
We can automatically transform the XAML code into that DOT code with the following XSLT code:
September 20, 2013 9:46 pm
Today I introduce a new home-made tool that automatically generates event graphs from a Mashup‘s source code.
I am currently doing some maintenance on a monster Mashup that has 20 data controls choreographed by 27 events where the height of the event tree is greater than 3, and I needed to understand the sequence of events so I can implement several new requirements in the Mashup without breaking the entire Mashup.
To assist me, I implemented a home-made tool with XSLT and XPath that automatically transforms the <mashup:Event> nodes of the Mashup XAML source code into a directed graph in the DOT graph description language that I rendered in GraphViz, an open source graph visualization software. I used what I learned from two of my previous tools: dependency graphs for data conversion, and Web Service pretty print.
Suppose we have a Mashup with a Search button that triggers a search on a Customer list. We would have the following XAML code:
<mashup:Event
    SourceName="BtnSearch"
    SourceEventName="Click"
    TargetName="CustomerList"
    TargetEventName="Search" />
The idea is to take each event’s properties SourceName, SourceEventName, TargetName, and TargetEventName, and display them in a directed graph with nodes, edges, and labels using this DOT syntax:
digraph g {
    BtnSearch -> CustomerList [label="Click > Search"];
}
The result will look like:
We can automatically transform the XAML code into that DOT code with the following XSLT code:
<?xml version="1.0" encoding="UTF-8"?>
<xsl:stylesheet version="1.0" xmlns:xsl="http://www.w3.org/1999/XSL/Transform" xmlns:mashup="clr-namespace:Mango.UI.Services.Mashup;assembly=Mango.UI">
    <xsl:template match="/">
        digraph g {
            <xsl:apply-templates select="//mashup:Event"/>
        }
    </xsl:template>
    <xsl:template match="mashup:Event">
        <xsl:value-of select="@SourceName"/> -> <xsl:value-of select="@TargetName"/> [label="<xsl:value-of select="@SourceEventName"/> > <xsl:value-of select="@TargetEventName"/>"];
    </xsl:template>
</xsl:stylesheet>
The problem is that not all Events are fully qualified with all the properties SourceName, SourceEventName, TargetName, and TargetEventName. For instance the Mashup has an implicit SourceName <Global> that does not need to be explicitly qualified in the code. And the Button has the implicit SourceEventName “Click” that does not need to be explicitly qualified either. Thus, we need to handle those cases in the XSLT code. The resulting XSLT code is long and complicated with many if-then-else to test if the properties are blank, and, if they are, to test if the control has a known implicit property.
Finally, we will need an XSLT processing engine in order to get the result. Most major browsers have a built-in XSLT engine, for instance Microsoft Internet Explorer, Google Chrome, Safari, and Mozilla Firefox have a built-in XSLT engine. To test my tool on your computer, you can use Internet Explorer, Safari, and Opera as they will process the XSLT file locally from the disk with file://… On the other hand, Firefox and Chrome for security reasons will only process the file if it’s served from a web server with http:// so you would have to setup your localhost.
You can download the final XSLT file at http://thibaudlopez.net/Mashups/EventGraph.xslt
Before using my tool, follow these steps:
To use my tool, follow these steps:


Here are the resulting event graphs for five of the Mashup Designer’s built-in examples:


In a future work, the XSLT code would have to be refined to cover all possible scenarios (blanks and implicit properties).
Also, we could include the Bookmark’s Keys or the Event’s Parameter Keys in the event graph, for example CONO, CUNO, ADRT, ADID.

Posted by thibaudatwork
Categories: Infor Smart Office Mashups
Tags: M3, Mashup, Smart Office, Tools
Mobile Site | Full Site
Get a free blog at WordPress.com Theme: WordPress Mobile Edition by Alex King.
[…] event graph animations for Mashups leveraging my previous tool that automatically generates event graphs for Mashup. The idea is to color-code the events in the event graph of a Mashup, and move forward in time to […]
LikeLike
By Color-coded event graph animations for Mashups | M3 ideas on October 2, 2013 at 4:47 pm
UPDATE: When you copy/paste the text from the blog post into your text editor, the double-quotes get corrupted, so you need to correct them manually.
LikeLike
By thibaudatwork on March 25, 2014 at 3:17 pm
UPDATE: I added support for LinkUri in EventGraph_V2.xslt.
LikeLike
By thibaudatwork on March 25, 2014 at 4:11 pm
[…] Event graphs for Mashups […]
LikeLike
By Site map – M3 ideas on May 9, 2017 at 12:25 pm
Hello Thibaud,
Can we create a Visualizer Panel, I mean Bar,Line Chart using data from Data List Panel i.e. Webservice.
I am fetching values for X-Axis and Y-Axis from Webservice and I want this values to be passed to Chart and respective graph as per value should be plotted.
Your help is highly appreciated.
BR,
Kiran Choudhari
LikeLike
By kiran on May 10, 2017 at 11:11 pm
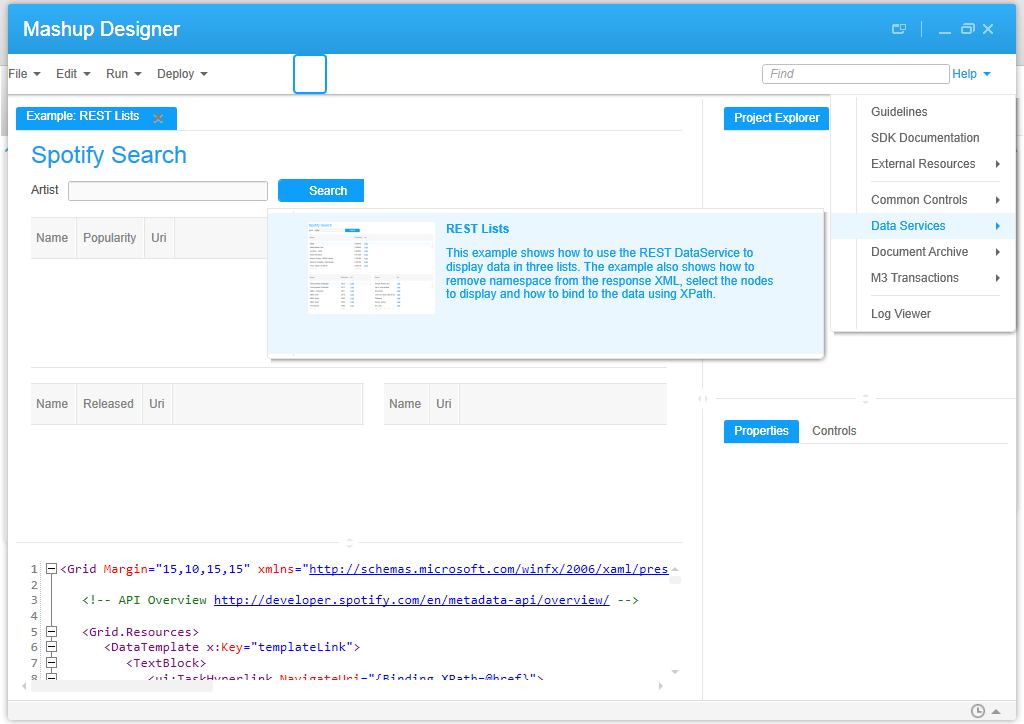
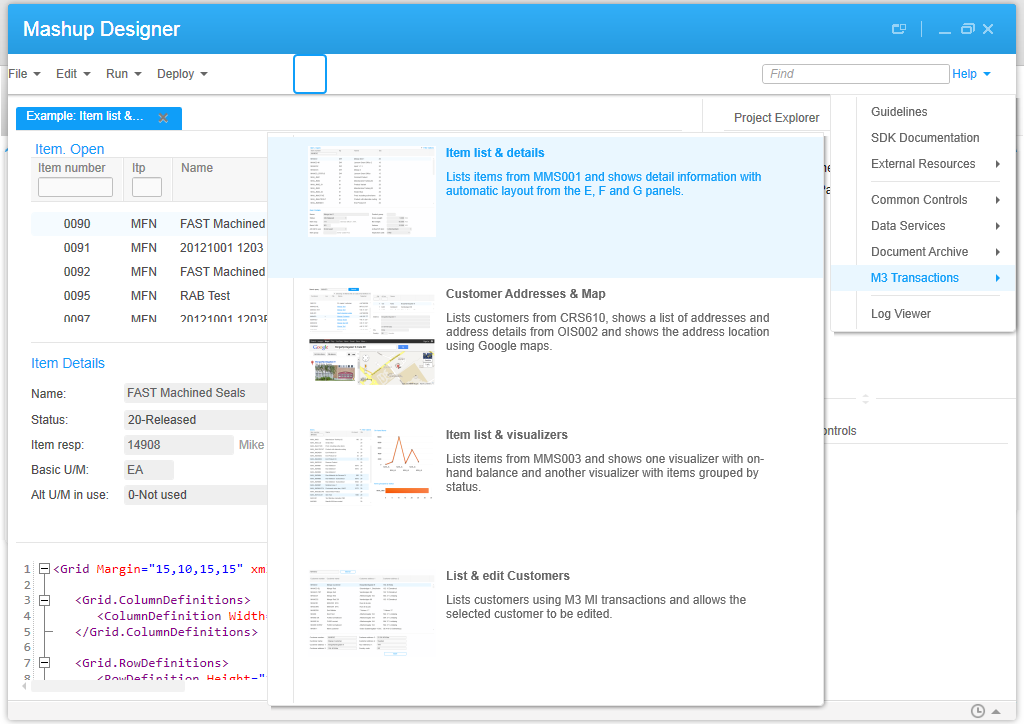
Hi Kiran. I think there are built in controls for charts. Look at the Mashup Designer > Help > Samples. I think the Item Mashup has charts. I think it feeds from M3 API, I don’t remember. It’s probably possible to feed from a web service instead. When you have it, let us know the solution. –Thibaud
LikeLike
By thibaudatwork on May 11, 2017 at 1:34 am