Here is a Hello World illustration of Augmented Reality (AR) for Infor M3 using Metaio Creator and the Junaio Browser on my iPad. The demo shows a 3D warehouse with aisles, racks, and levels, where I highlighted one of the boxes in red. This new result complements my previous demo of AR for M3 which was implemented programmatically in JavaScript. This time I am using Metaio Creator.
Why it matters
The idea is to highlight the stock location of the the next item to pick in a picking list so the picker can quickly identify where to go in the warehouse. This scenario is specially useful for temporary workers that are hired for campaigns on short notice and are not yet familiar with the warehouse thus saving costs in training and picking time.
Also, Augmented Reality is predicted to be one of the next multi-billion dollar industries in five years from now, so this is one of the learning steps I am taking in that direction.
Preview the demo
To preview the demo on your device (PC, Mac, iPad, Android) follow these instructions:
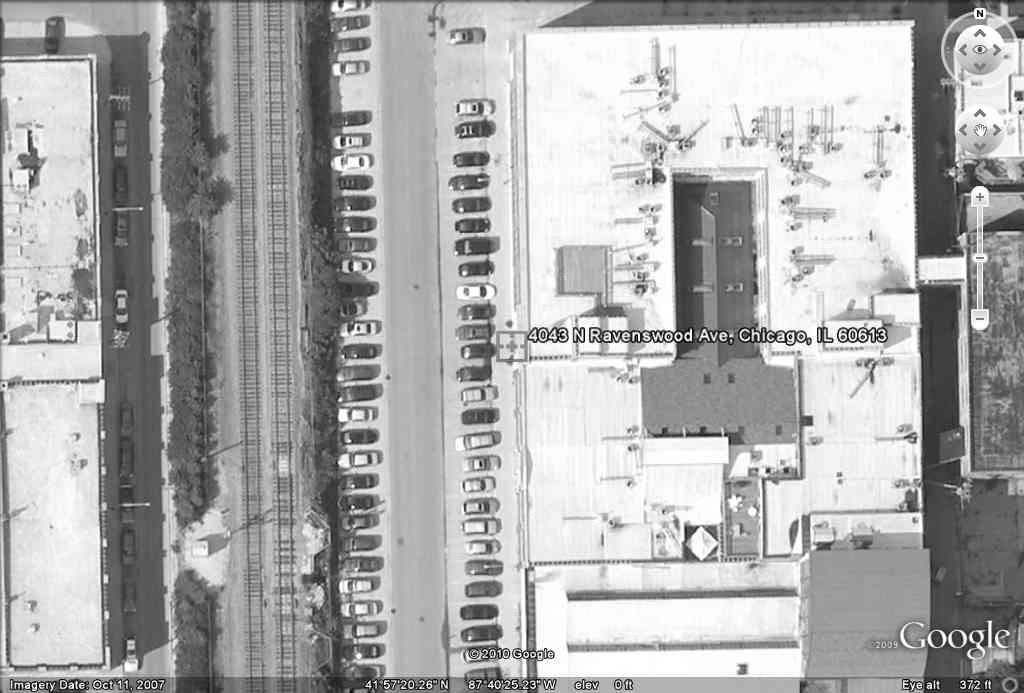
Print the following satellite picture in full page or bigger, and place it on a flat surface; that will be the trackable AR marker:
Install the Junaio Augmented Reality Browser app on your device (from junaio.com for PC/Mac, from the App Store for iPad, or from the Google Play Store for Android).
Open the app and click Scan.
Scan the following QR code; Junaio Browser will identify the QR code, and will download the resources from my channel ThibaudWarehouse3D:
Point your device’s camera towards the printed satellite picture. Junaio Browser will track the satellite picture and will register the warehouse 3D accordingly. Here is a screenshot of the result:
How I built it
The creation process is simple.
I used my previous 3D model of a warehouse with racks, aisles, levels, and boxes that I had created in SketchUp for a demo three years ago. I removed the walls and roof. I removed unnecessary 3D elements that slow down the 3D rendering pipeline on iPad. And I hard-coded an arbitrary box in red.
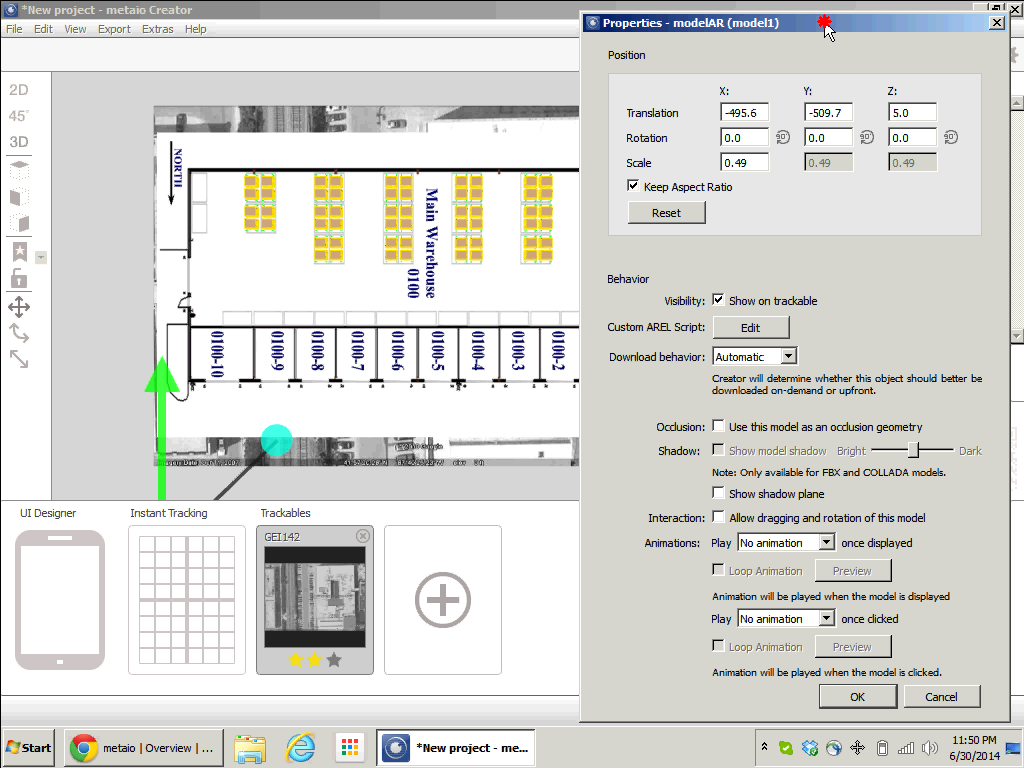
Here is a screenshot of the trackable and 3D model in Metaio Creator:
Here is a screenshot of the channel creation:
Here is a video of the entire creation process and preview:
Summary
That was how to create a simple Hello World demo of Augmented Reality for M3 using a 3D warehouse and Metaio Creator to highlight the stock location of the next item to pick in a picking list to save training time and picking time.
Future version
In a future version, I will un-hard-code the red box, and I will highlight it programmatically using Metaio SDK.
Here is a video that illustrates the process to set the Geo Codes XYZ of Stock Locations in MMS010 in Smart Office, i.e. to set the latitude, longitude, and altitude of Stock Locations, a.k.a. geocoding. In my example I determined the coordinates based on an 3D model built in Google SketchUp and geo-located in Google Earth; a GPS receiver with good indoor accuracy would work as well. With geocoded information, we can present data from the Warehouse Management System in a graphical way. This is important for applications such as showing Stock Locations on a map, or finding the shortest path for a picking list.
Demo video
How to proceed
These are the steps I followed in the video to geolocate the Stock Locations in MMS010:
I used this SketchUp model of a 3D warehouse that I had previously geo-located:
I also used this other SketchUp model of the Stock Locations that I had previously uniquely identified:
Then, I used this Ruby script to get the geocoding of the floor plan:
Then, I used this other Ruby script to get the geocoding of each Stock Location:
The result is this CSV file of the floor plan’s geocodes and each Stock Location’s geocodes:
Then, I used this Lawson Web Service of type Display Program to set the values for the fields Geo Code X (GEOX), Geo Code Y (GEOY), and Geo Code Z (GEOZ) in MMS010/F for a specified Warehouse (WHLO) and Stock Location (WHSL):
Then, I used a Visual Basic macro for Microsoft Excel to call the Web Service for all Stock Locations:
Finally, I used this script to display the Geo Codes XYZ in MMS010/B1:
Result
The result is the list of Stock Locations in MMS010/B1 displaying all the Geo Codes XYZ:
Resources
Download the SketchUp model of the geo-located 3D warehouse.
Download the SketchUp model of the uniquely identified Stock Locations.
Download the Ruby script to get the geocoding of the floor plan.
Download the Ruby script to get the geocoding of each Stock Location.
Download the resulting CSV file of all Stock Locations and their Geo Codes.
Download the Lawson Web Service to set the Geo Codes XYZ of a Stock Location.
Download the script to display the Geo Codes XYZ in MMS010/B1.
2012-09-28: I had a bug in the Ruby script that miscalculated the Y and Z geocodes for the Stock Locations. I corrected the script and the resulting CSV file and I updated the links above.
I implemented a Warehouse 3D demo that demonstrates the integration capabilities of M3 with cool stuff from the software industry.
The Warehouse 3D demo displays racks and boxes with live data coming from Stock Location – MMS010, and Balance Identity – MMS060. The Location Aisle, Rack, and Level of MMS010 is written dynamically on each box. The Status Balance ID of MMS060 is rendered as the color of the box: 1=yellow, 2=green, 3=red, else brown. And the Item Number is generated dynamically as a real bar code that can be scanned on the front face of the box.
You can try the demo for yourself with your own M3 environment. For that, you will need several things. You will need to install the Google Earth plugin in your browser. You will also need to deploy the Lawson Web Service for MMS060MI provided here; note that your LWS server must be in a DMZ so that the http://www.ibrix.info web server can make the SOAP call over HTTP. Also, you will need to follow the Settings wizard to setup your own M3 environment, user, password, CONO, WHLO, etc. The result is a long URL that is specific to your settings.
You can download the resulting SketchUp model here.
Identifying front faces
Then, I identified each front face of each box so as to dynamically overlay information, such as the Item Number, Item Name, etc. For that, I implemented another Ruby script.
The original model is a SKP filetype, which is binary. I exported the model to a Collada DAE filetype, which is XML. The file is very big, 30.000 lines of XML.
The Collada file contains this:
Components (racks, boxes, walls, etc.)
Homogenous coordinates (X, Y, Z, H) relative to the model
Absolute coordinates (latitude, longitude)
Orientation (azimut, etc.)
Scale
Effects (surface, diffusion, textures, etc.)
Colors in RGBA
From the top of my head, the Collada hierarchy in XML is something like this:
Node Instance
	Node Definition
		Instance Geometry
			Instance Material
				Material
					Instance Effect
						Color
						Surface
							Image
Making the model dynamic
The goal is to set the color of each box dynamically, based on the Location of the box, and based on the Inventory Status in MMS060.
Unfortunately, Google Earth doesn’t have an API to change the color of a component dynamically. So, I decided to change the XML dynamically on the server. There are certainly better solutions but that’s the one I chose at the time. And I chose PHP because that’s what I had available on my server ibrix.info; otherwise any dynamic web language (ASP, JSP, etc.) would have been suitable.
In the XML, I found the mapping between the box (nodeDefinition) and its color (material). So, I changed the mapping from hard-coded to dynamic with a PHP function getColor() that determines the color based on the Location and based on the result of the web service call.
The color is determined by the Balance ID: 1=yellow, 2=green, 3=red, else brown. The Balance ID is stored in the SOAP Response of the web service.
Lawson Web Service
I created a SOAP-based Lawson Web Service for MMS060MI. I invoke the SOAP Web Service at the top of the PHP script, and store the Response in a global variable. To call SOAP Web Services, I use NuSOAP, an open source PHP library.
Generating front faces
I dynamically generate a texture for each each front face as a PNG image with the Item Number, Item Description, Quantity, and the bar code. I set the True Type Font, the size, the XY coordinates, and the background color.
Bar code
I generate an image of the bar code based on the Item Number using PEAR, an open source PHP library.
Settings wizard
I made a Settings wizard to assist the user in setting up a demo with their own M3 environment, user, password, CONO, WHLO, etc.
Applications
This Warehouse 3D demo illustrates possible applications such as:
Monitoring a warehouse
Locating a box for item picking
Implementing Augmented Reality to overlay relevant data on top of the boxes
Demo
Finally, I made a demo video using the back projection screen at the Lawson Schaumburg office, and using Johny Lee’s Low-Cost Multi-point Interactive Whiteboards Using the Wiimote and my home made IR pens to convert the back projection screen into a big touch screen. The 3D model in the demo has 10 Aisles, 6 Racks per Aisle (except the first aisle which only has 4 racks), and 4 Levels per Rack. That’s 224 boxes. There is also a floor plan that illustrates that structure.
Limitations
The main limitation of this demo is performance. When programming with Google Earth we do not have the capability of dynamically changing a 3D model. I would have liked to dynamically set the color of a box, and dynamically overlay text on the face of a box. Because that capability is lacking – there’s no such API in the Google Earth API – I chose to generate the XML of the 3D model dynamically on the server. As a result, the server has to send 30k lines of XML to the web browser over HTTP, it has to generate 224 PNG images and transfer them over the network, and the Google Earth plugin has to render it all. As a consequence, it takes between one and four minutes to fully download and render the demo. This design turns out to be inadequate for this type of application. Worse, it is not scalable nor improvable. I would have to re-think the design from scratch to get a more performant result.
Future Work
If I had to continue working on this project (which is not planned), I would implement the following:
Ideally, we would generate boxes, colors, and text dynamically on the client-side, with JavaScript and WebGL for example. Google Earth doesn’t support that, and generating the model on the server-side turns out to be a bad design. So we need a different technique.
Also, we would need to implement hit detection, so as to click on a box and display more M3 data in a pop-up for example. Google Earth supports even listeners but doesn’t yet support hit detection.
Finally, we would need to improve performance by an order of magnitude.
Thanks
Special thanks to Gunilla A for sponsoring this project and making it possible.
Resources
Download Ruby script to set the Aisle, Rack, and Level of each box as in MMS010
Download Ruby script to identify each front face of each box so as to dynamically overlay information
Download SketchUp model with floor plan, geo-location, racks, and walls
Download SketchUp model of boxes identified by Stock Location
Watch video of the 3D model being built in Google SketchUp
Watch video of the process of setting the Aisle, Rack, and Level of each box as in MMS010
Watch video of the process of identifying each front face of each box