Today I unbury old scripts from my archives, and I post them here and on my GitHub.
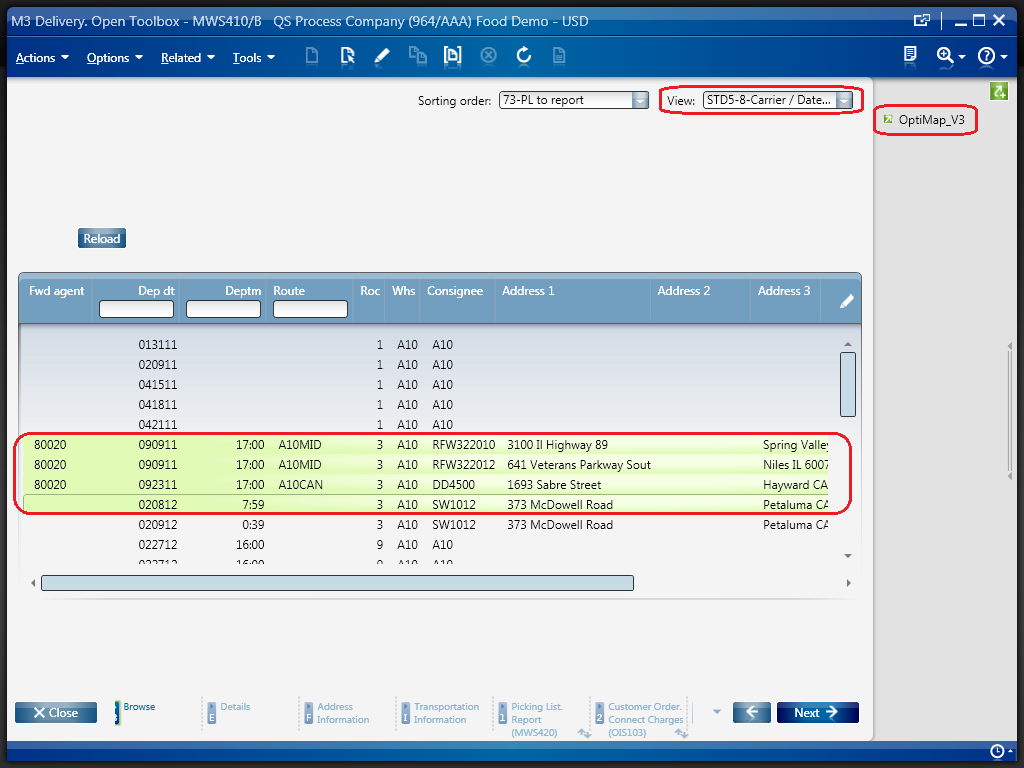
This script illustrates how to integrate the M3 Delivery Toolbox – MWS410/B with OptiMap – Fastest Roundtrip Solver to calculate and show on Google Maps the fastest roundtrip from the Warehouse to the selected Delivery addresses; it’s an application of the Traveling Salesman Problem (TSP) to M3. This is interesting for a company to reduce overall driving time and cost, and for a driver to optimize its truck load according to the order of delivery.
OptiMap_V3
The Warehouse (WHLO) is now detected from the selected rows, and its address is dynamically retrieved using API MMS005MI.GetWarehouse; no need to specify the Warehouse address as a parameter anymore.
Create a view in M3 Delivery Toolbox MWS410/B that shows the address fields in the columns (e.g. ADR1, ADR2, ADR3), and set the field names in the parameter of the script.
OptiMap_V4 [PENDING]
Add ability to Export OptiMap’s route to M3 Loading (MULS) and Unloading sequence (SULS) using API MYS450MI.AddDelivery, closing the loop of integrating M3 to OptiMap.
This is an idea for version 4. Script to be developed…
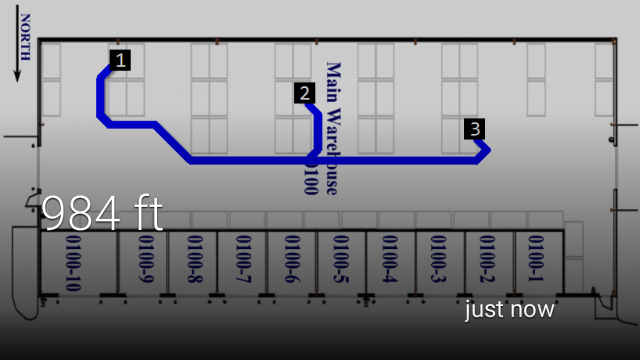
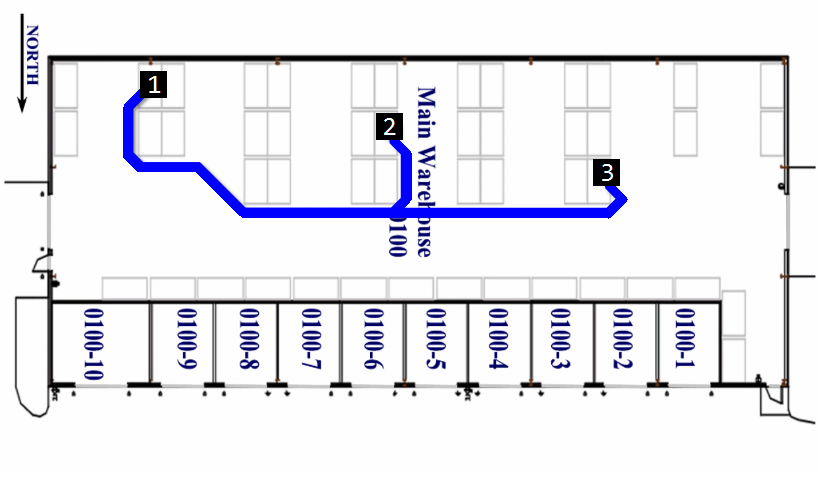
Today I will illustrate how I started implementing my proof-of-concept for walking directions in a warehouse, and I will provide the source code. The goal is to show the shortest path a picker would have to walk in a warehouse to complete a picking list and calculate the distance for it. This is most relevant for big warehouses and for temporary staff that are not yet familiar with a warehouse. The business benefit is to minimize picking time, reduce labor costs, increase throughput, and gather performance metrics. I used this for my demo of M3 picking lists in Google Glass.
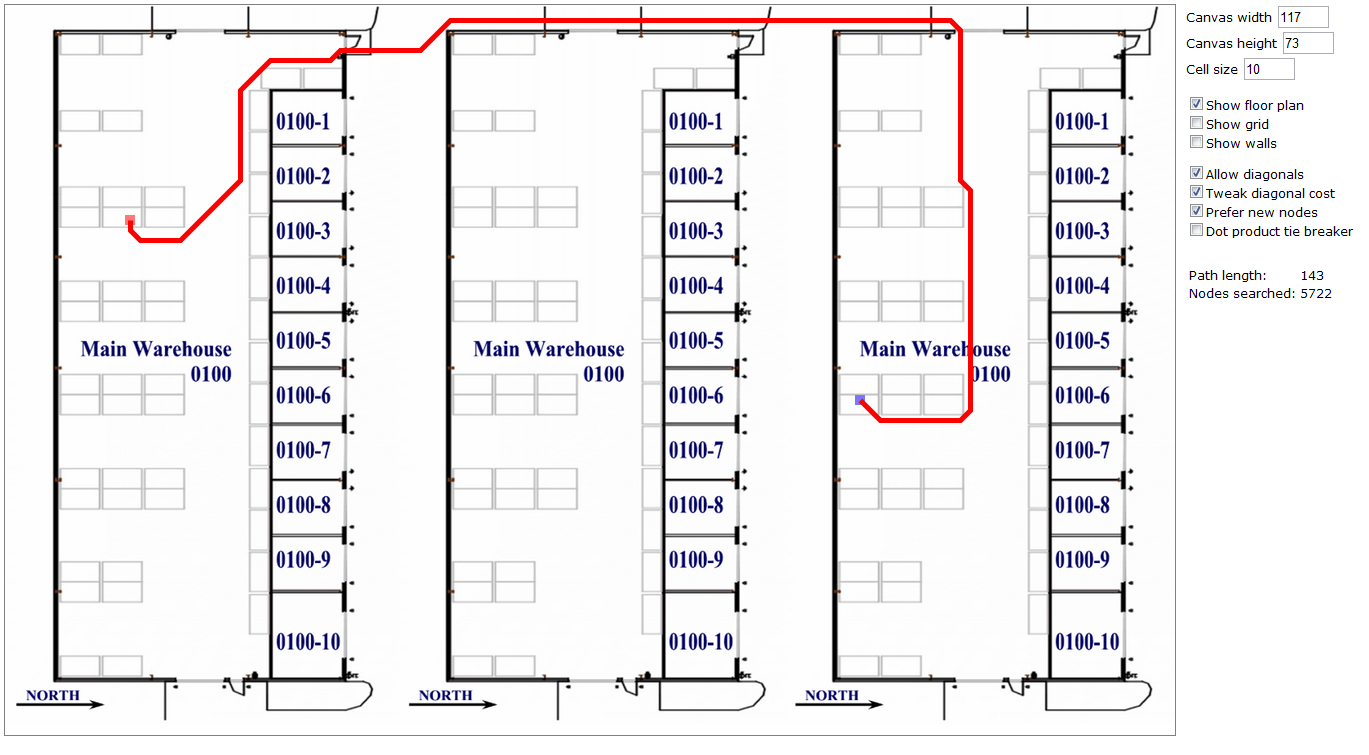
A* search algorithm
I used Will Thimbleby’s wonderful illustration of A* shortest path in Javascript. We can drag and drop the start and stock locations to move them around and recalculate the path, and we can draw walls. I made the map bigger, and I put a warehouse image as a background.
Implementation
Here are the steps I performed:
Double the map’s width/height
Un-hard-code the map width/height
Set the cell size and calculate the canvas width/height
Un-hard-code the cell size
Make a warehouse image in an image editor (I used Gimp)
Add the warehouse image as background of the map
Hide the heat map (search scores)
Patiently draw the map, the walls, the doors, and the stock locations
Save the drawing by serializing the map to JavaScript source code
Replace startMap with the saved drawing
Thicken the path’s stroke
Hide the grid lines
Hide the map
Use diagonals
Emphasize the path length
Here is a video of the making process (watch it in full-screen, HD, and 2x speed):
Result
You can test the result for yourself on my website here.
Here is an animated GIF of the result:
Here is a video of the result for a small warehouse:
Here is a video of the result for a big warehouse:
Source code
I put the resulting HTML, JavaScript source code and images in my GitHub repository for you to download and participate.
I am very pleased to announce that after months of working here and there in the evenings voluntarily after work hours, I finally completed and presented both my demos of M3 picking lists in Google Glass and Augmented Reality at Inforum. They were a success. I showed the demos to about 100 persons per day during six days flawlessly with very positive reception. The goal was to show proof of concepts of wearable computers and augmented reality applied to Infor M3. My feet hurt.
I created a custom subscriber and added a subscription to Event Analytics to M3:MHPICL:U.
It uses the Google Mirror API for simplicity to illustrate the proof-of-concept.
I have been making the resulting source code free and open source on my GitHub repository, and I have been writing the details on this blog. I will soon post the remaining details.
Acknowledgements
I want to specially thanks Peter A Johansson of Infor GDE Demo Services for always believing in my idea, his manager Robert MacCrate for providing the servers on Infor CloudSuite, Philip Cancino formerly of Infor for helping with the functional understanding of picking lists in M3, Marie-Pascale Authié of Infor Pre-Sales for helping me setup and create picking lists in M3 and for also doing the demo at Inforum, Zack Makris of Infor Labs for providing technical support, Jonathan Amiran of Intentia Israel for helping me write the Grid application, and some people of Infor Product Development that chose to remain anonymous for helping me write a Java application for Event Hub and Document Archive. I also want to specially thank all the participants of Inforum whom saw the demo and provided feedback, and all of you readers for supporting me. And I probably missed some important contributors, thank you too. And thanks to Google X (specially Sergey Brin and Thad Starner) for believing in wearable computers and for accelerating the eyewear market.
Screenshots
Here below are the screenshots from androidcast. They show the bundle cover, the three pick list lines with the items to pick, the Confirm custom menu action, the Read aloud action, and the walking directions in the warehouse:
Vignettes
Here below are three vignettes of what the result would look like to a picker:
Inforum
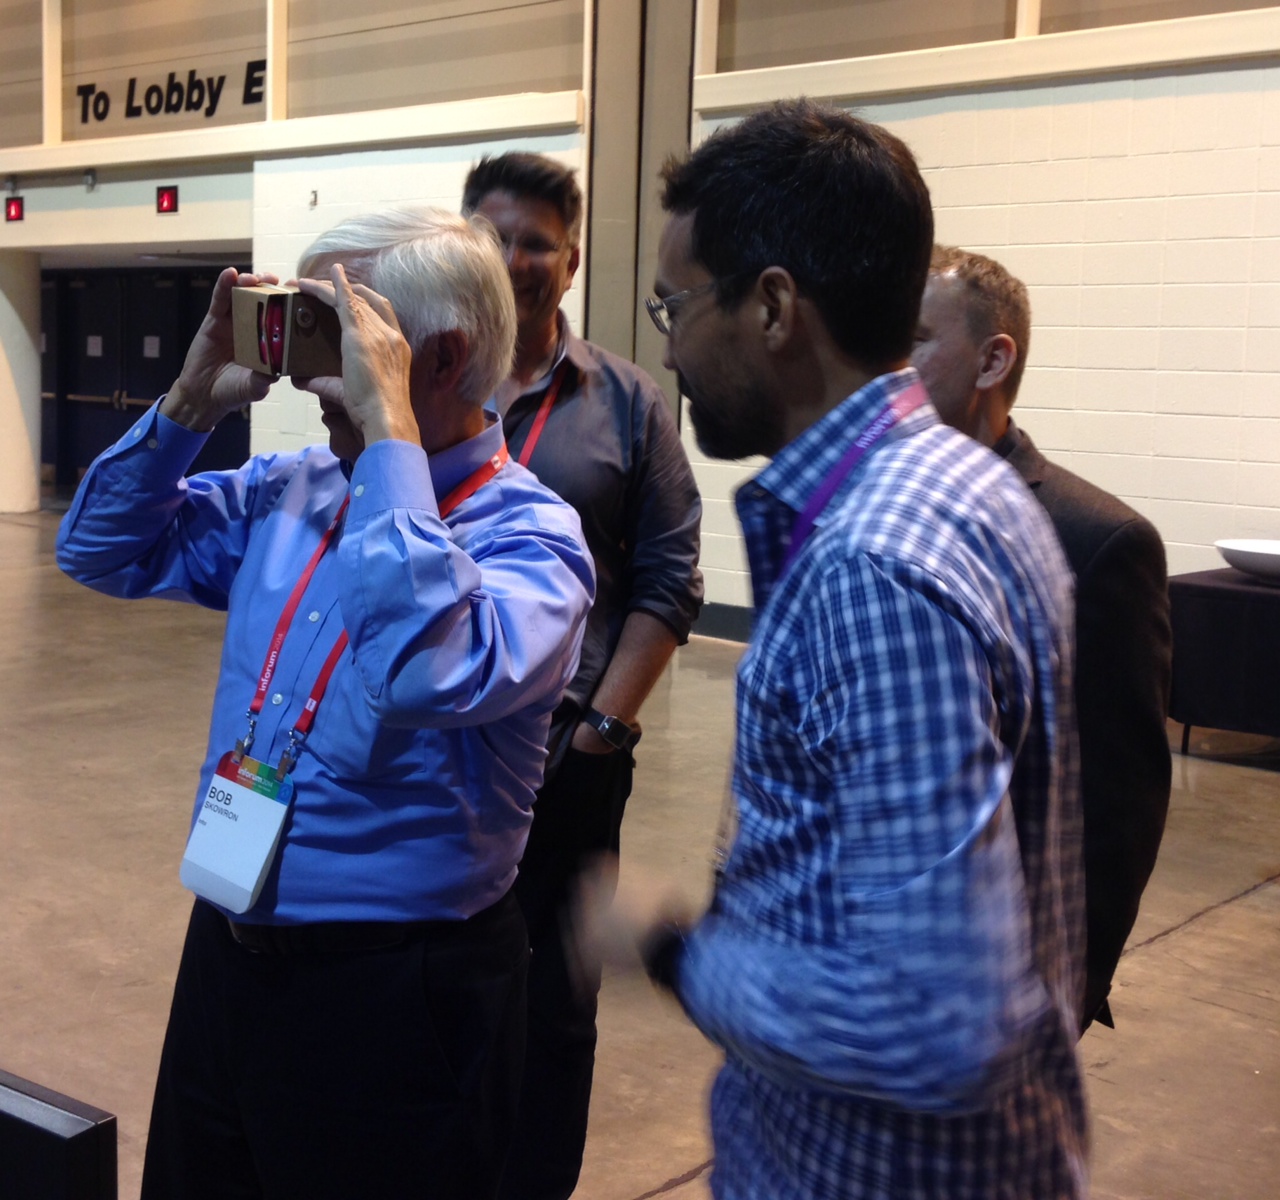
Here are some photos at Inforum:
In the Manufacturing area:
In front of the SN sign:
Holding my Augmented Reality demo:
Playing around with picking lists in virtual reality (Google Cardboard, Photo Spheres, and SketchFab):
Playing around with picking lists in Android Wear (Moto 360):
That’s it! If you liked this, please thumbs up, leave a comment, subscribe to this blog, share around you, and come help me write the next blog post, I need you. Thank you!
Two years ago I had implemented a proof-of-concept that showed walking directions in a warehouse to complete a picking list. The idea is to visually represent what a picker has to do, and where they have to go, while calculating the minimum distance they have to walk. It will make it easier to get the job done for pickers that are not familiar with a warehouse, like temporary staff. And the business benefit is to minimize picking time, to make savings in labor costs, and to increase throughput. Also, we can save performance data on the ground, derive the gap between goals versus results, and use that as a feedback loop for continuous improvement of internal processes.
And there is more work to be done. For instance, the calculation responds quickly on my laptop for about 11 picking list lines, perhaps 13 with the ant colony optimization, but beyond that the calculation time grows exponentially beyond useful. Also, the calculation does not take into account bottleneck or collision avoidance for forklifts. Currently, this project is a great proof-of-concept to be further explored.
When Google Maps launched their outstanding Indoor Maps I had shelved my small project. But Google Indoor Maps requires the maps to be public which our M3 customers are reluctant to do. So for Inforum this week, I un-boxed my project and integrated it in my Google Glass demo. Here below are some screenshots of the project. I will be writing a series of posts soon on how to implement it. And I would like your feedback.
In future work, I will implement the same proof-of-concept using Google Indoor Maps.
Here is a Hello World illustration of Augmented Reality (AR) for Infor M3 using Metaio Creator and the Junaio Browser on my iPad. The demo shows a 3D warehouse with aisles, racks, and levels, where I highlighted one of the boxes in red. This new result complements my previous demo of AR for M3 which was implemented programmatically in JavaScript. This time I am using Metaio Creator.
Why it matters
The idea is to highlight the stock location of the the next item to pick in a picking list so the picker can quickly identify where to go in the warehouse. This scenario is specially useful for temporary workers that are hired for campaigns on short notice and are not yet familiar with the warehouse thus saving costs in training and picking time.
Also, Augmented Reality is predicted to be one of the next multi-billion dollar industries in five years from now, so this is one of the learning steps I am taking in that direction.
Preview the demo
To preview the demo on your device (PC, Mac, iPad, Android) follow these instructions:
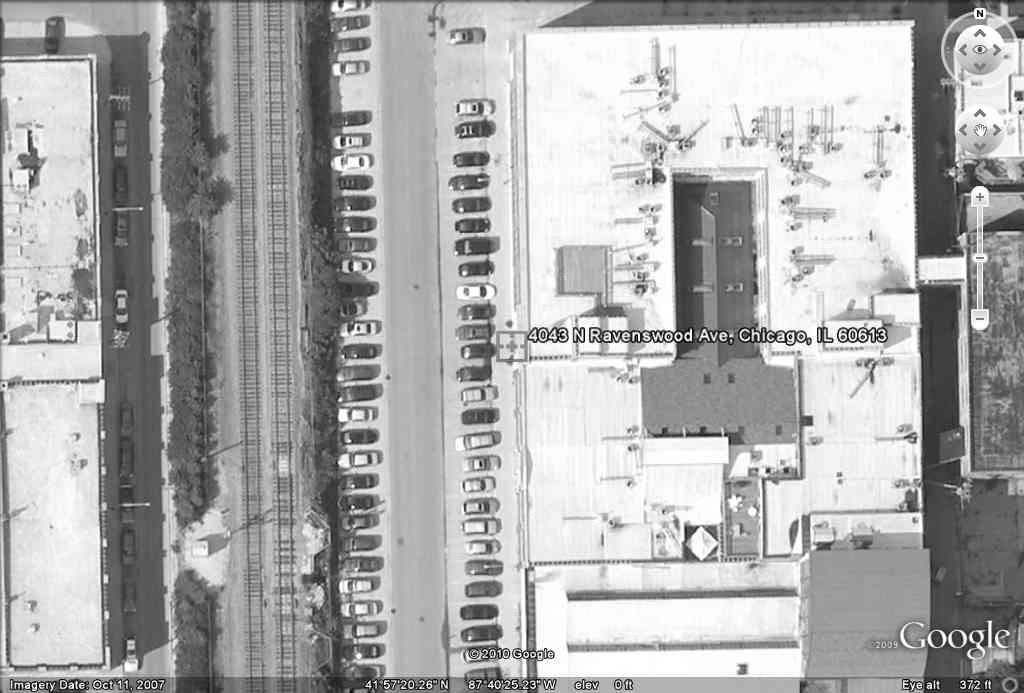
Print the following satellite picture in full page or bigger, and place it on a flat surface; that will be the trackable AR marker:
Install the Junaio Augmented Reality Browser app on your device (from junaio.com for PC/Mac, from the App Store for iPad, or from the Google Play Store for Android).
Open the app and click Scan.
Scan the following QR code; Junaio Browser will identify the QR code, and will download the resources from my channel ThibaudWarehouse3D:
Point your device’s camera towards the printed satellite picture. Junaio Browser will track the satellite picture and will register the warehouse 3D accordingly. Here is a screenshot of the result:
How I built it
The creation process is simple.
I used my previous 3D model of a warehouse with racks, aisles, levels, and boxes that I had created in SketchUp for a demo three years ago. I removed the walls and roof. I removed unnecessary 3D elements that slow down the 3D rendering pipeline on iPad. And I hard-coded an arbitrary box in red.
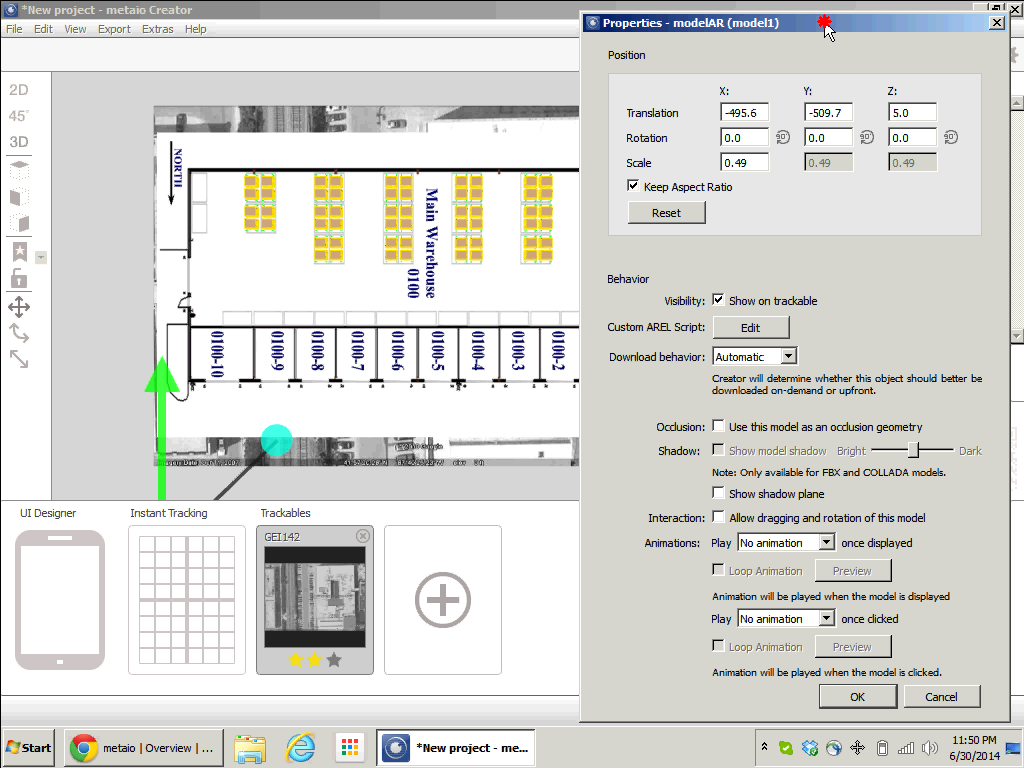
Here is a screenshot of the trackable and 3D model in Metaio Creator:
Here is a screenshot of the channel creation:
Here is a video of the entire creation process and preview:
Summary
That was how to create a simple Hello World demo of Augmented Reality for M3 using a 3D warehouse and Metaio Creator to highlight the stock location of the next item to pick in a picking list to save training time and picking time.
Future version
In a future version, I will un-hard-code the red box, and I will highlight it programmatically using Metaio SDK.
“University of Bremen student Hannes Baumann demonstrates using a wearable computer for order picking. 750,000 warehouses worldwide distribute approximately $1 US trillion in goods, and order picking accounts for about 60% of the total operational costs of a warehouse. Using a head-up display to guide order picking virtually eliminates errors and is significantly faster than paper or audio based methods. HUD-based order picking is also less expensive and more flexible than many other automated picking techniques. Hannes’s thesis work was supported by the SiWear project and advised by Professor Thad Starner and Professor Michael Lawo.” — Thad Starner, Published on Sep 7, 2012
Last week I attended the Augmented World Expo (AWE) 2014 [1] in Santa Clara, one of the world conferences on Augmented Reality, Virtual Reality, Augmented Virtuality [2], and smart glasses [3]. There, I saw Steve Feiner, pioneer of Augmented Reality in the 1990s [4][5], Professor of computer science and director of the Computer Graphics and User Interfaces Lab at Columbia University, and adviser for Space Glasses at Meta [6]. I also saw Mark Billinghurst, director of the HITLab in New Zealand [7] whom created the AR Toolkit which I later used (JavaScript port) for my prototype M3 + Augmented Reality. I didn’t see Steve Mann, also adviser for Meta, and one of the pioneers of the Wearable Computing group in the Media Lab in the 1980s [8]; Thad Starner was in that group and later went on to design Google Glass for Sergey Brin [9]. I got inspiration from their work when I was younger, and I was excited to see them.
I went to the conference to learn more about the future. I’m currently working on a personal project to develop an app to display picking lists in Google Glass with data from Infor M3.
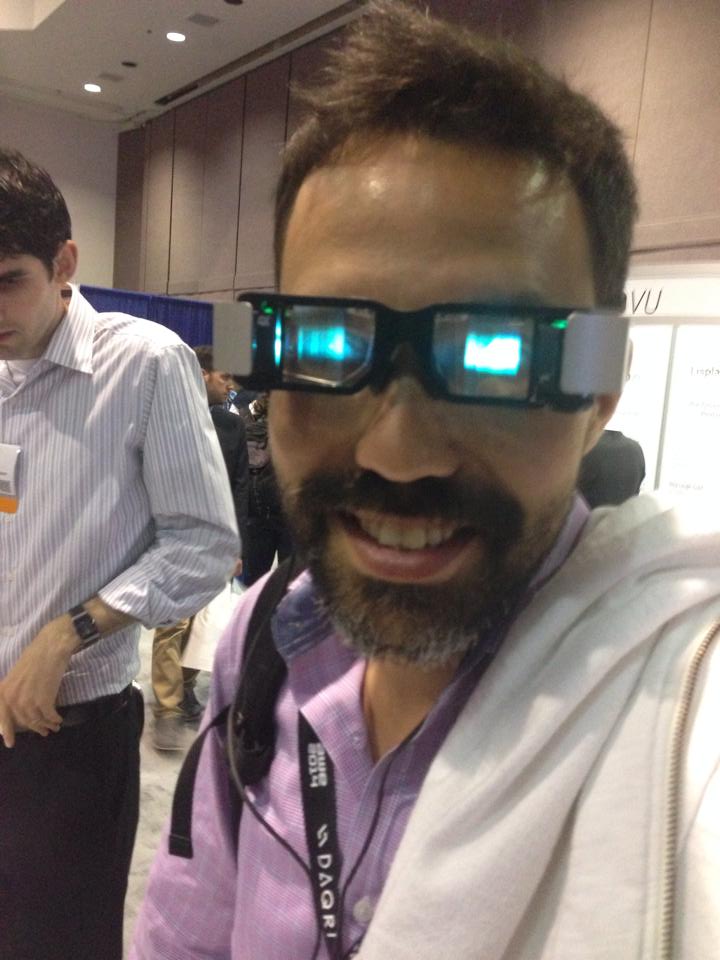
Here are some pictures of me at the conference, dreaming my vision of future picking lists 😉
As a reminder, I’m developing a proof-of-concept to show rich picking lists from Infor M3 in Google Glass with item number, item description, quantity, stock location, image of the item from Infor Document Archive, and walking directions in a warehouse plan. Also, for interactivity, the picker will be able to tap Glass to confirm the picking. Also, the picker will be able to take a picture of a box at packing.
The result will be useful to showcase the integration capabilities of M3, it’s a first implementation of wearable computing for M3, and it sets a precedent for future Augmented Reality experiments with M3. And the advantages for a picker in a warehouse would be more efficiency and new capabilities. And for me it’s a way to keep my skills up-to-date, and it’s an outlet for my creativity. It’s a lot of software development work, and I’m progressing slowly but steadily on evenings and on week-ends. If you would like to participate please let me know.
Why it matters
According to Gartner, by 2016, wearables will emerge as a $10 billion industry [1].
According to Forbes, “Smart glasses with augmented reality (AR) and head-mounted cameras can increase the efficiency of technicians, engineers and other workers in field service, maintenance, healthcare and manufacturing roles”[2].
According to MarketsandMarkets, the Augmented Reality and Virtual Reality market is expected to grow and reach $1.06 billion by 2018 [3].
Basics of Google Glass
Google Glass is one of the first wearables for the mass market. It is a notification device on the face, an eyewear with all the capabilities of an Android device including camera, head-mounted display, touchpad, network connectivity, voice recognition, location and motion sensors.
It works by displaying a timeline of cards we can swipe back and forth to show past and present events.
To write applications for Google Glass we can use the Mirror API, the Glass Development Kit (GDK), or standard Android development. I will use the Mirror API for simplicity.
I will display an M3 picking list as a series of detailed cards on the timeline that pickers can swipe and interact with like a to-do list as they are progressing in their picking.
Card template
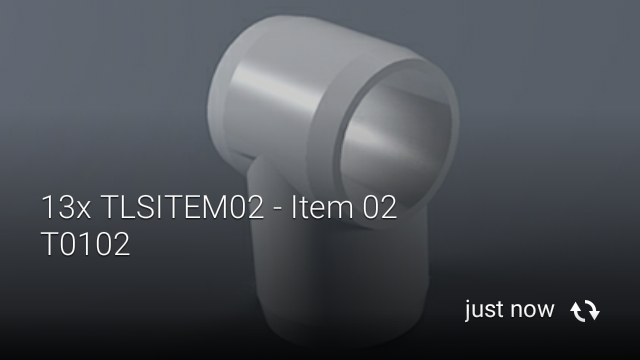
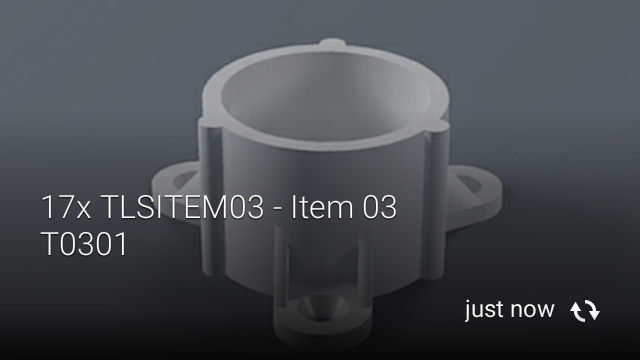
For the template of the timeline card, I will use SIMPLEEVENT from the Google Mirror API Playground per picking list line to easily identify the four pieces of information the picker will need to read per picking list line: item quantity, item number, item description, and stock location:
Bundling
I will use Bundling with bundleId and isBundleCover to group the cards together by picking list:
Picking list lines
I will get the picking list lines with the SQL of my previous post, and I will sort them in descending order because Glass will display them reversely last in, first out, thus they will appear naturally in-order to the user.
SELECT H6WHSL, H6ITNO, H6ITDS, H6ALQT
FROM MVXJDTA.MHPICD
WHERE H6CONO=<!CONO> AND H6DLIX=<!DLIX> AND H6PLSX=<!PLSX>
ORDER BY H6WHSL DESC
HTML card
I will use the SIMPLEEVENT template’s HTML fragment and replace the sample values with item quantity ALQT, item number ITNO, item description ITDS, and stock location WHSL:
I will embed the HTML fragment in the JSON payload for the Mirror API:
{
	"html": html,
	"bundleId": DLIX
}
Bundle cover
The bundle cover will be:
{
	"text": "Picking list <!DLIX>",
	"bundleId": <!DLIX>,
	"isBundleCover": true
}
Infor Process File
My process file in Infor Process Designer is illustrated in this GIF animation (you can open it in Gimp and see the layers in detail):
Problems
I had to solve the following two trivial problems:
I had problems parsing new line characters in the MsgBuilder activity node with JavaScript in an Assign activity node. According to the ECMAScript Language Specification – ECMA-262 Edition 5.1 on String Literals the character for new line is simply \n (line feed <LF>). Then Samar explained to me that the MsgBuilder activity node in IPA uses both characters \r\n (carriage return <CR> and line feed <LF>).
JSON is not implemented in IPA for JavaScript in the Assign activity node. So I had to manually add it to IPA. I used Douglas Crockford’s json2.js, and I appended it in the two files <IPDesigner>\IPD\pflow.js and <IPALandmark>\system\LPS\pflow.js.
I still have the following problem:
The subscription I used in my previous post, M3:MHPICL:U, seems to occur too early in some of my tests, and that is a blocking problem because when my flow runs the SQL to get the picking list lines only gets the first line – which is the only line that exists in the database at that point in time – while the other lines haven’t yet been created in the database at that time and the flow misses them. I must find a solution to this problem. I haven’t been able to reproduce it.
Result
From my previous post, I had the following picking list:
H6WHSL
H6ITNO
H6ITDS
H6ALQT
T0101
TLSITEM01
Item 01
11
T0102
TLSITEM02
Item 02
13
T0301
TLSITEM03
Item 03
17
T0302
TLSITEM04
Item 04
19
When I re-run the scenario, here are the resulting timeline cards in my Google Glass where black pixels are see-through pixels:
And here is a video capture of the result (I used Android screencast which captures at a slow frame rate):
And here is a picture of what it would look like to the user in Glass with see-through pixels:
Future work
Next, I will implement the following:
Programmatically get the OAuth 2.0 token instead of copy/pasting it manually in the WebRun activity nodes.
Show the item image from Infor Document Archive.
Show walking directions on a warehouse plan.
Tap to confirm the picking.
Take a picture of the box at packing.
That’s it! Check out my previous posts on the project. Like this post. Tell me what you think in the comments section below. Share with your colleagues, customers, partners. Click the Follow button to subscribe to this blog. Be an author and publish your own ideas. And enjoy.
Here is the second version of the OptiMap script for Smart Office that integrates the Delivery Toolbox – MWS410/B with OptiMap – Fastest Roundtrip Solver to calculate and show on Google Maps the fastest roundtrip for the selected Routes. This extends the first version of the script.
In this second version I added the possibility to set the starting address (for example the Warehouse) as the Script argument. See lines 52-54.
import System;
import System.Web;
import System.Windows;
import Mango.UI.Services.Lists;
import MForms;
/*
OptiMap_V2 for M3
Thibaud Lopez Schneider, Infor, October 19, 2012 (rev.2)
This script illustrates how to integrate the Smart Office Delivery Toolbox - MWS410/B with OptiMap - Fastest Roundtrip Solver, http://www.optimap.net/
to calculate and show on Google Maps the fastest roundtrip for the selected Routes; it's an application of the Traveling Salesman Problem (TSP) to M3.
This is interesting for a company to reduce overall driving time and cost, and for a driver to optimize its truck load according to the order of delivery.
To install this script:
1) Deploy this script in the mne\jscript\ folder of your Smart Office server
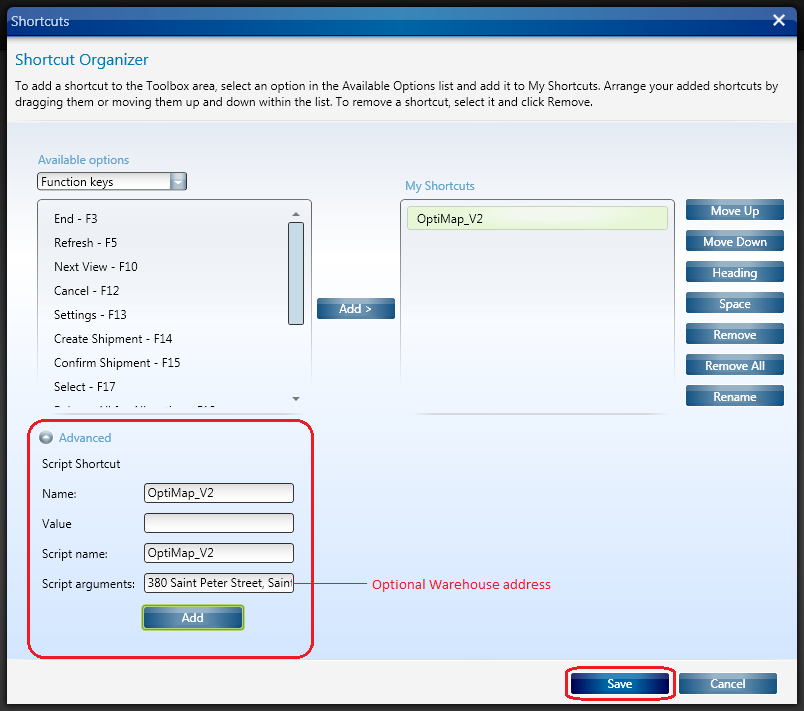
2) Create a Shortcut in MWS410/B to run this script; for that go to MWS410/B > Tools > Personalize > Shortcuts > Advanced > Script Shortcut, set the Name to OptiMap, and set the Script name to OptiMap
3) Optionally, set the starting address (for example the Warehouse) as the Script argument; the address must be recognized by Google Maps
4) Create a View (PAVR) in MWS410/B that shows the address columns ADR1, ADR2, ADR3
To use this script:
1) Start MWS410/B
2) Switch to the View (PAVR) that shows the address columns ADR1, ADR2, ADR3
3) Select multiple Routes in the list (press CTRL to select multiple rows)
4) Click the OptiMap Shortcut
5) The Shortcut will run the script, the script will launch OptiMap in a browser and pass the selected addresses as locN parameters in the URL, and OptiMap will optimize the roundtrip
For more information and screenshots refer to:
https://thibaudatwork.wordpress.com/2012/10/04/route-optimization-for-mws410-with-optimap/
https://thibaudatwork.wordpress.com/2013/03/08/optimap_v2/
*/
package MForms.JScript {
class OptiMap_V2 {
public function Init(element: Object, args: Object, controller : Object, debug : Object) {
try {
// get a reference to the list
var listControl: MForms.ListControl = controller.RenderEngine.ListControl;
var listView: System.Windows.Controls.ListView = controller.RenderEngine.ListViewControl;
if (listControl == null || listView == null) { MessageBox.Show('Error: Couldn\'t find the list.'); return; }
// get the selected rows
var rows = listView.SelectedItems; // System.Windows.Controls.SelectedItemCollection
if (rows == null || rows.Count == 0) { MessageBox.Show('Error: Select multiple routes in the list (press CTRL to select multiple rows).'); return; }
// get the address columns ADR1, ADR2, ADR3
var column1: int = listControl.GetColumnIndexByName('ADR1');
var column2: int = listControl.GetColumnIndexByName('ADR2');
var column3: int = listControl.GetColumnIndexByName('ADR3');
if (column1 == -1 || column2 == -1 || column3 == -1) { MessageBox.Show('Error: Couldn\'t find the address columns ADR1, ADR2, ADR3.'); return; }
// construct the URL
var query: String = 'http://www.optimap.net/?';
// set the optional starting address
var offset: int = 0;
if (!String.IsNullOrEmpty(args)) { offset=1; query += 'loc0=' + HttpUtility.UrlEncode(args) + '&'; }
// add the selected addresses
for (var i: int = 0; i < rows.Count; i++) {
var row: ListRow = rows[i];
var ADR1: String = row[column1];
var ADR2: String = row[column2];
var ADR3: String = row[column3];
var address: String = ADR1 + ',' + ADR2 + ',' + ADR3;
query += 'loc' + (i+offset) + '=' + HttpUtility.UrlEncode(address) + '&';
}
// launch OptiMap in a browser
ScriptUtil.Launch(new Uri(query));
} catch (ex: Exception) {
MessageBox.Show(ex);
}
}
}
}
Here is a screenshot of how to set the address as an Argument of the script:
That’s it!
(Oh, and I finally learned how to post source code to WordPress. Duh!)
Google Glass is an anticipated product from Google X for bringing Augmented Reality to the masses in a sports fashion pair of glasses containing a video camera, a Heads-Up Display, a processing unit running Android, Wifi connectivity, and a battery (c.f. the patent).
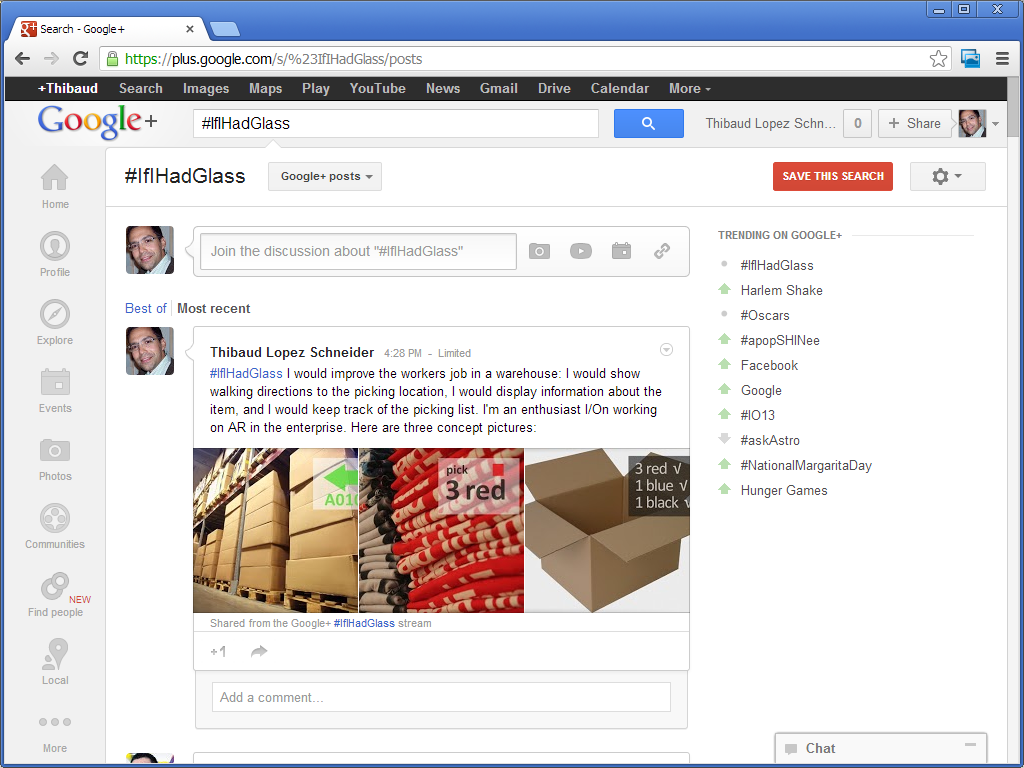
If I had Glass I would improve the workers job in a warehouse: I would show walking directions to the picking location, I would display information about the item, and I would keep track of the picking list. I’m an enthusiast I/On working on AR in the enterprise.