Here is the sixth article in the series on Hacking Infor Grid application development, and today I will illustrate how to debug the Grid application at runtime. This is useful for development and troubleshooting purposes. For that, I will use the standard Java Platform Debugger Architecture (JPDA) that is included in Java.
I will do the illustration gradually: I will start by debugging a simple HelloWorrrld class from the command line, then I will debug it remotely, then I will debug it from Eclipse, and finally I will debug the Infor Grid application.
Remember the intention is to hack ethically, to learn and to push the boundaries of what is possible. Also, remember to join the campaign and sign the petition asking Infor Product Development to make their source code available so we can do better work. Also, next week is Open Access Week, and it is a great time to ask Infor Product Development to make more of their documentation available.
Debugging from the command line
Here is a quick illustration of how to use jdb, the Java Debugger, to debug a simple HelloWorrrld class from the command line.
Here is the simple HelloWorrrld class:
public class HelloWorrrld {
    public static void main(String[] args) {
        int i = 11;
        int j = 13;
        int k = i * j;
    }
}
Suppose we want to debug the class at runtime and set a breakpoint at line 6 to see the value of variable k.
For that, we compile the class with the -g command line parameter to generate all debugging information, including local variables; by default, only line number and source file information is generated:
javac -g HelloWorrrld.java
Then, we have jdb launch a new Java Virtual Machine (VM) with the main class of the application to be debugged by substituting the command jdb for java in the command line:
jdb HelloWorrrld
Then, we set the breakpoint at line 6:
stop in HelloWorrrld:6
We could have also stopped execution at the beginning of the main method instead of at a specific line number:
stop in HelloWorrrld.main
Then, we start the execution of the debugged application:
run
The debugger will execute up to the breakpoint, at which point we can display the value of k:
print k
It will display k = 143.
Then, we advance execution to the next line and so on until the end:
step
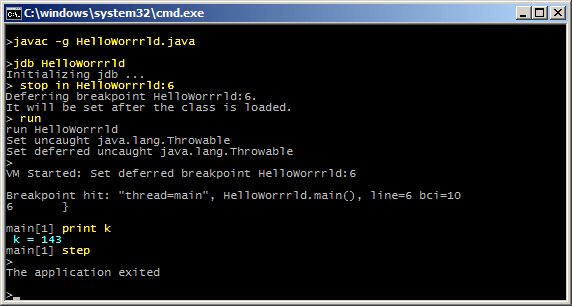
Here is a screenshot of the steps:
Debugging remotely
Now I will illustrate how to debug the same class remotely by attaching jdb to a Java VM that is already running.
First, we find a port number that is available on the host where we will run the class, for example I use netstat, and for example I will try port number 1234:
netstat -an | findstr :1234
If netstat returns LISTENING then that port number is already in use and unavailable; otherwise you can use it.
Then, we start the Java VM (the debuggee) with the following options to load in-process debugging libraries and specify the kind of connection to be made and allow jdb to connect to it at a later time:
java -agentlib:jdwp=transport=dt_socket,address=127.0.0.1:1234,server=y,suspend=y HelloWorrrld
-agentlib:jdwp loads the native agent library for the Java Debug Wire Protocol (JDWP).
suspend=y makes the JVM wait on startup for a debugger to attach before running.
transport=dt_socket sets the transport specification to socket transport using a single stream TCP/IP connection between the debugger application and the target VM.
address=1234 is the port number to which the debugger should attach to the JVM. This number should normally be above 1024. Verify that it is available.
server=y indicates that the JVM is accepting connections from debuggers.
Then, on the remote host (the debugger), we start jdb and attach it to the remote Java VM (the debuggee), and we specify the path of the source files:
jdb -sourcepath ./src/ -connect com.sun.jdi.SocketAttach:hostname=host,port=1234
Here is a screenshot of the steps:


Debugging from Eclipse
Now I will illustrate how to debug the same class remotely from Eclipse.
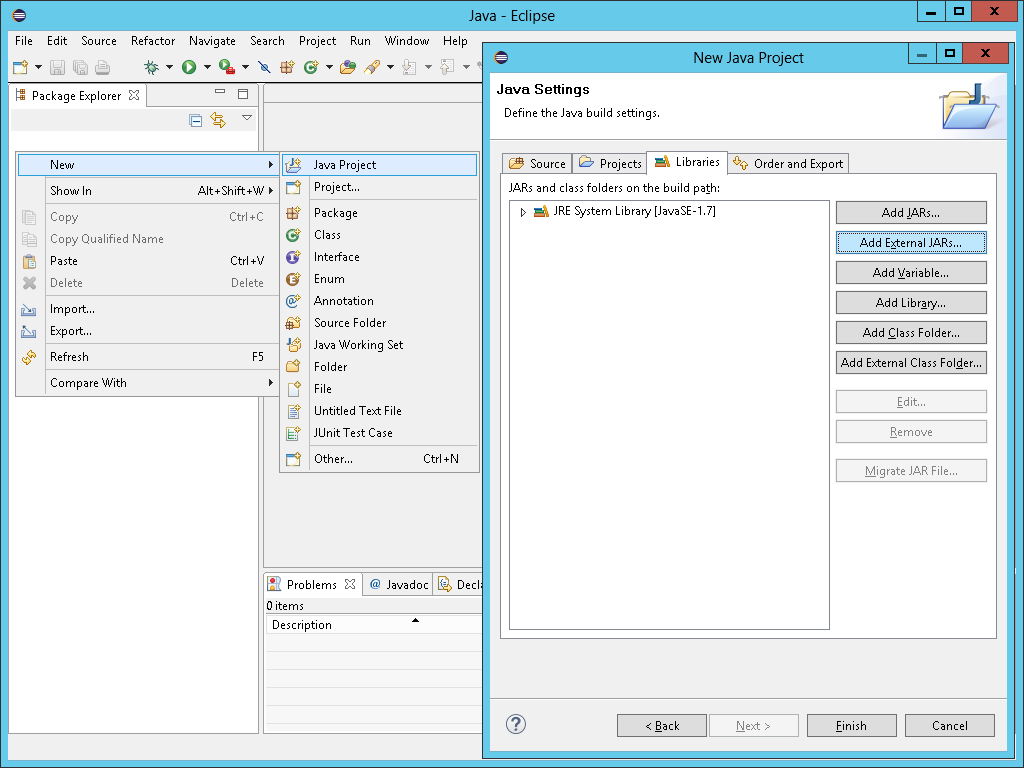
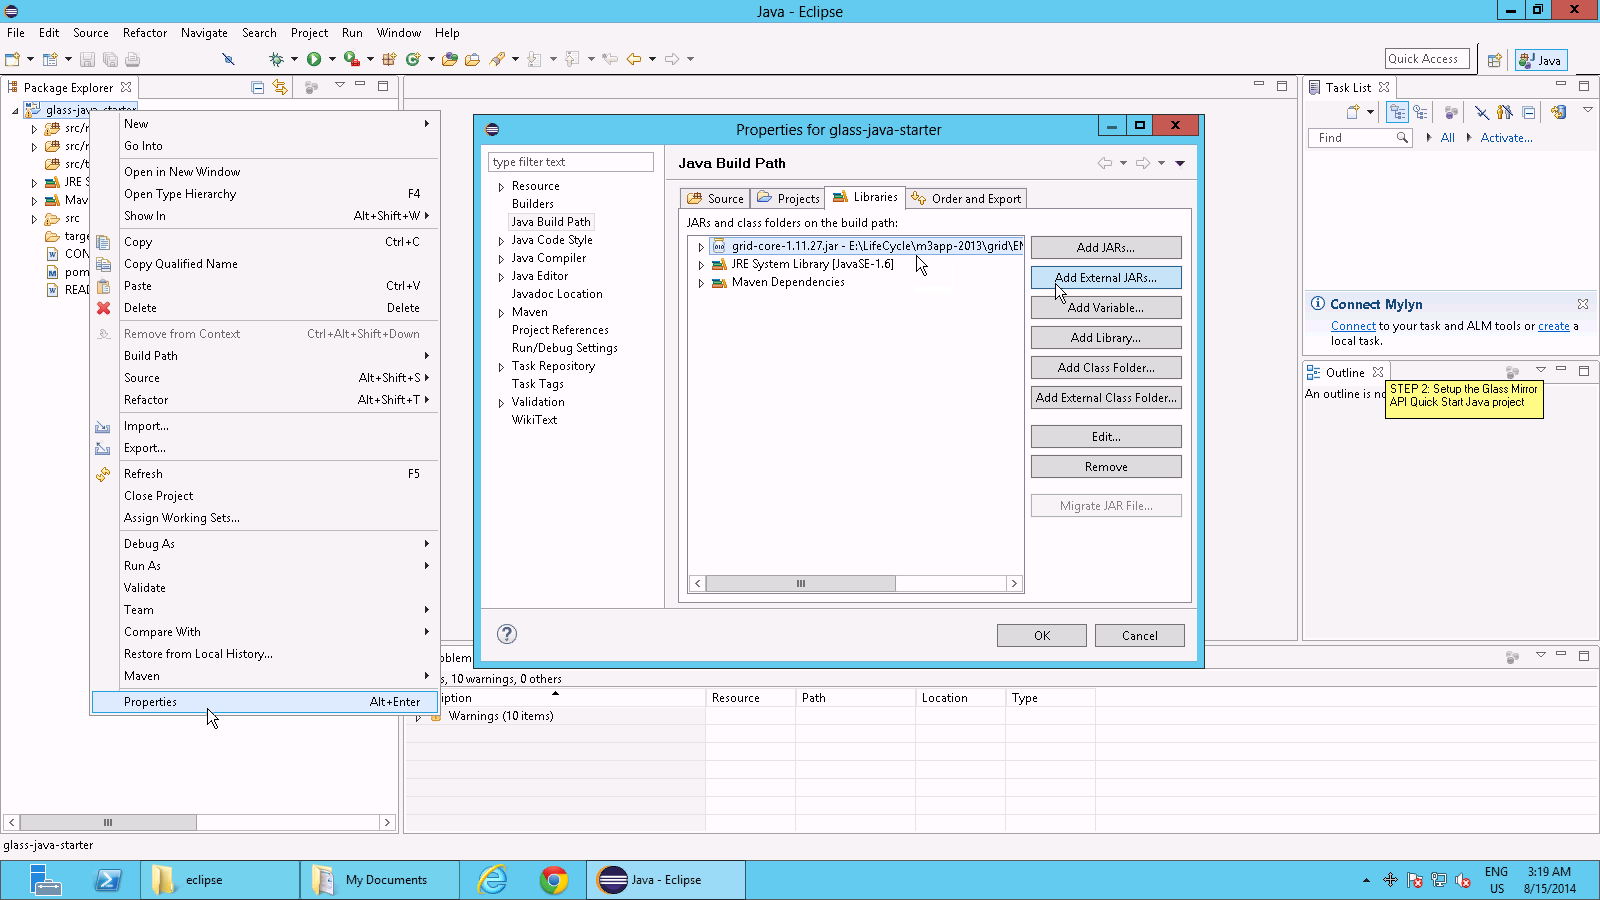
First, create a new Java Project in Eclipse, and import the source code of the Java class, and set the desired breakpoints:

Then, select Run > Debug Configurations.
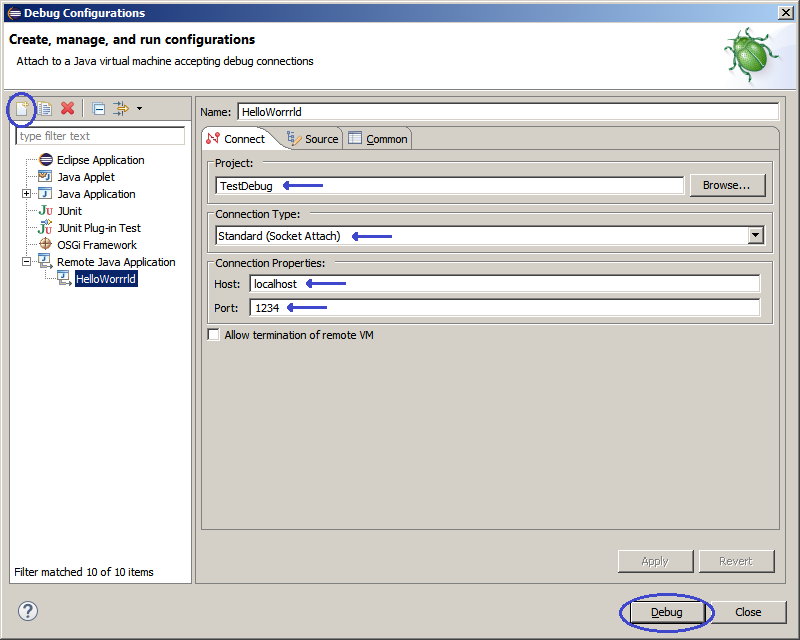
Then, click New launch configuration, select the Project, Connection Type Standard (Socket Attach), Host, Port, Source, and click Debug:

Open the Debug perspective, and debug as usual with threads, stepping, immediate console, local variables, etc.:

Debugging Infor Grid application
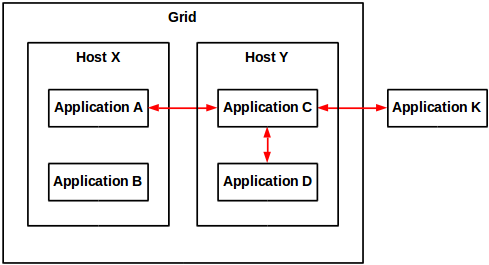
Finally, I will illustrate how to debug our Infor Grid application remotely at runtime. We will need the source code of that Grid application, for example I will use the source code I wrote in part 4 of this series.
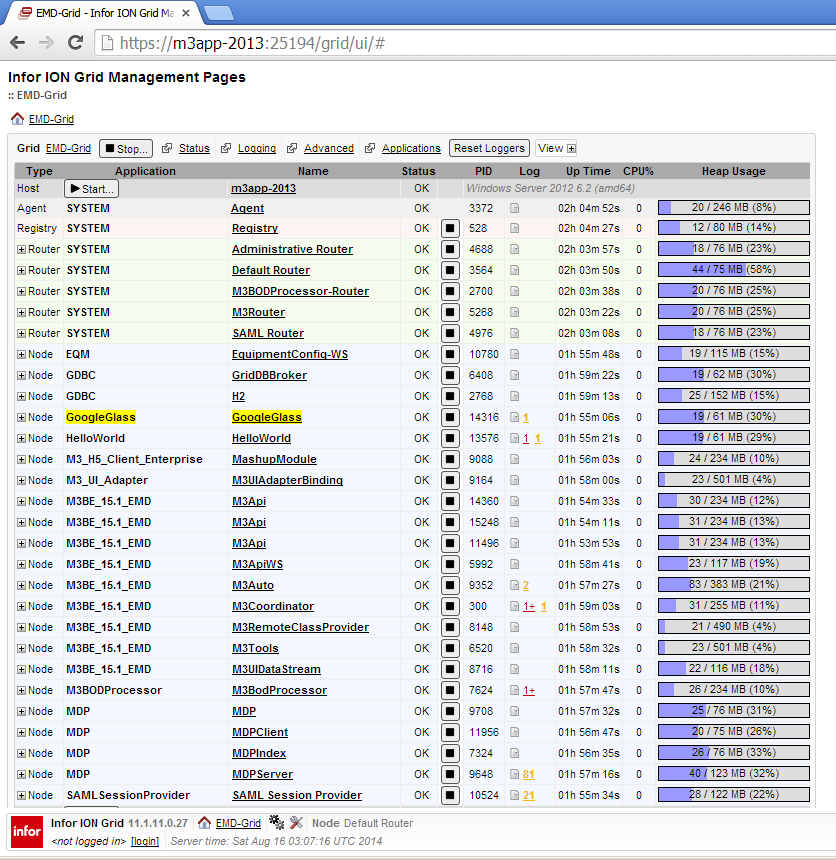
As a reminder, an Infor Grid application runs in a Grid Node, and a Grid Node is a Java VM. We will set the JDWP debugging options on that Java VM (debuggee). For that, we must change the Java command line options. Fortunately, there is a convenient node property Debug Port in the Node properties that takes care of it.
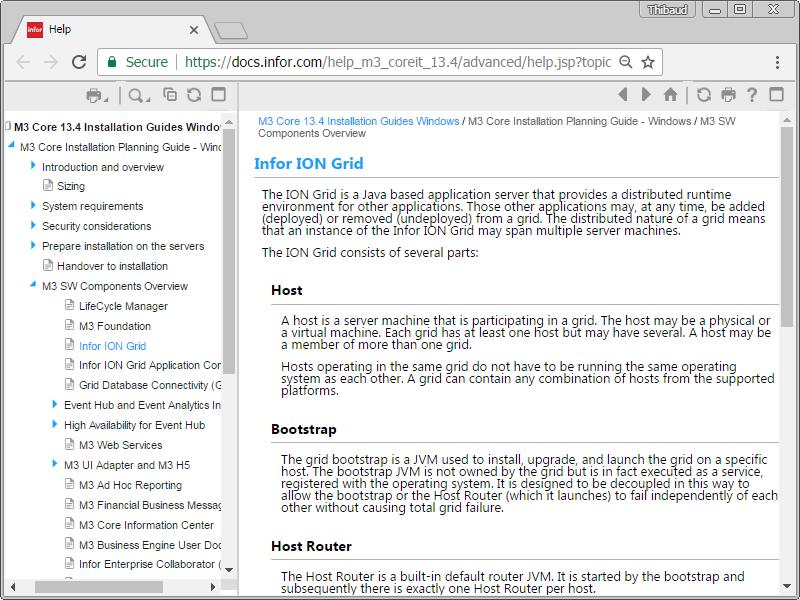
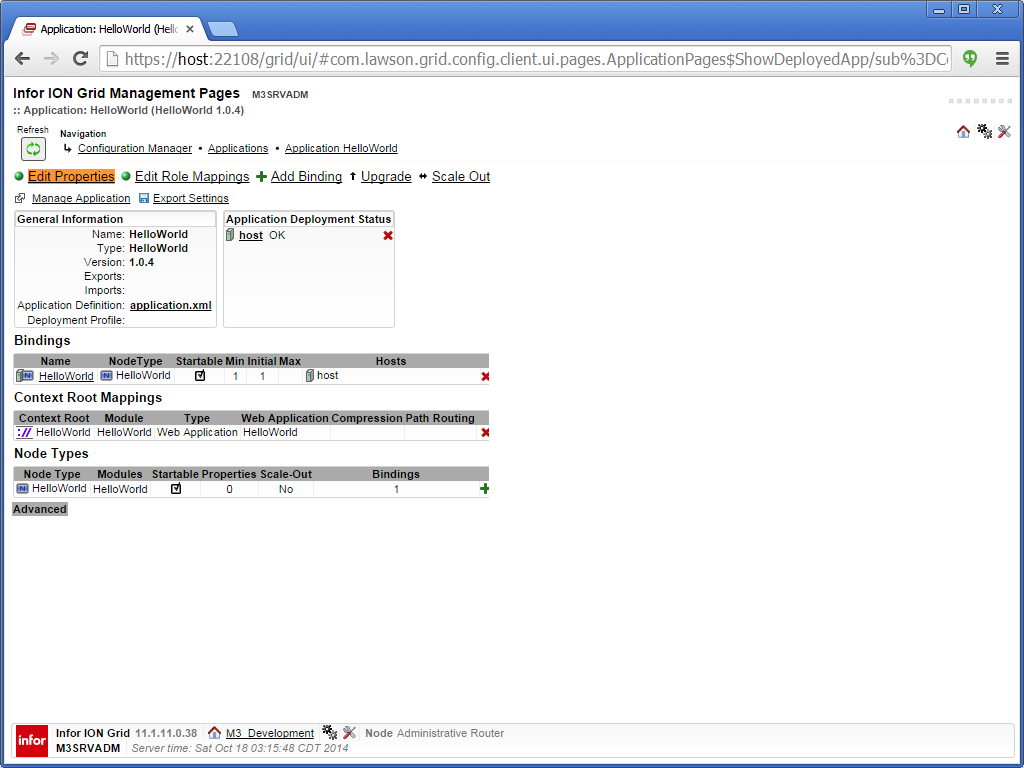
Select Infor ION Grid Management Pages > Applications > HelloWorld > Configuration:

Select Edit Properties:

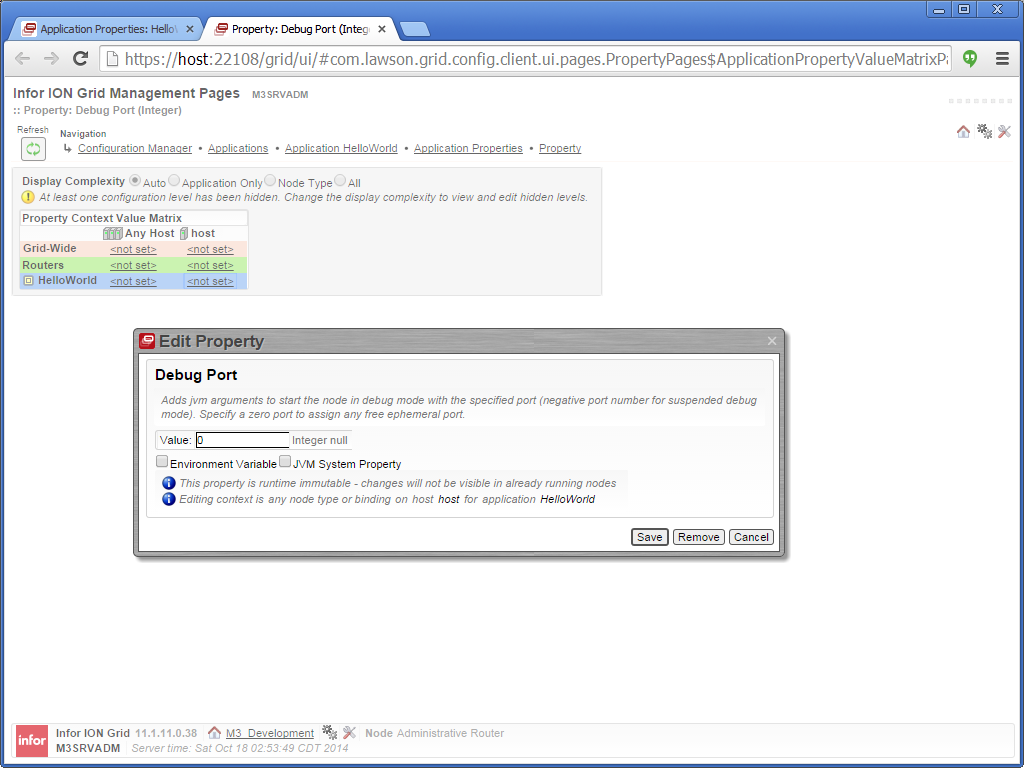
Select Debug Port:

Set the application’s debug port number (specify a zero port to assign any free ephemeral port), and save the configuration changes:

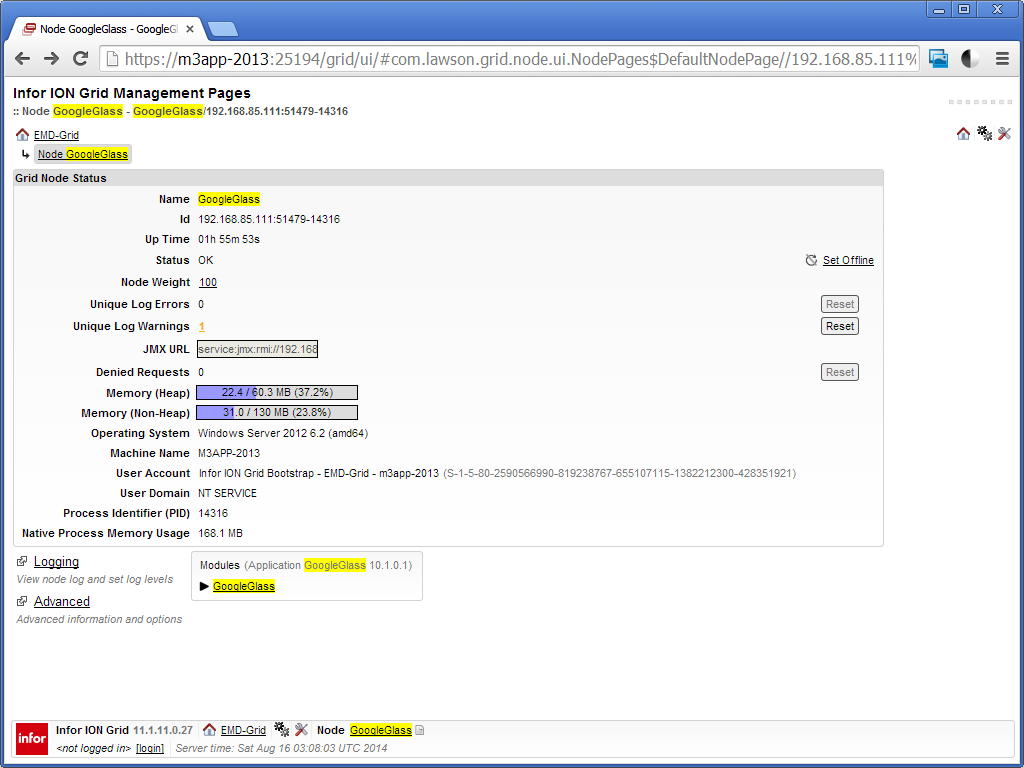
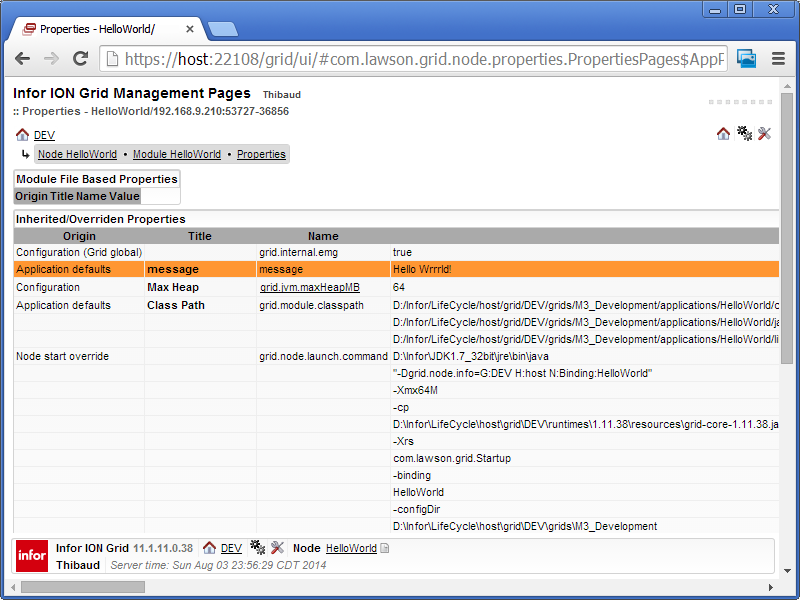
Then, go to the Node Properties (Node > Advanced > Properties), ensure the debugging options were set, and take note of the port number:

Now, stop the Node, and wait until it restarts automatically, for the Java VM debug options to take effect:

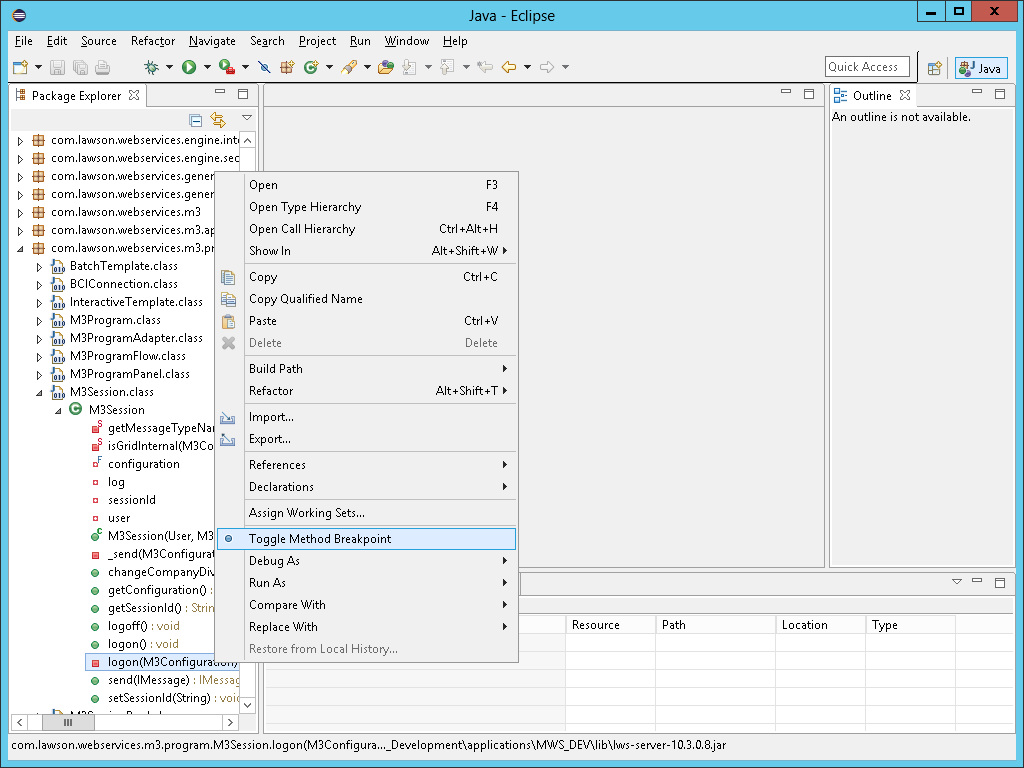
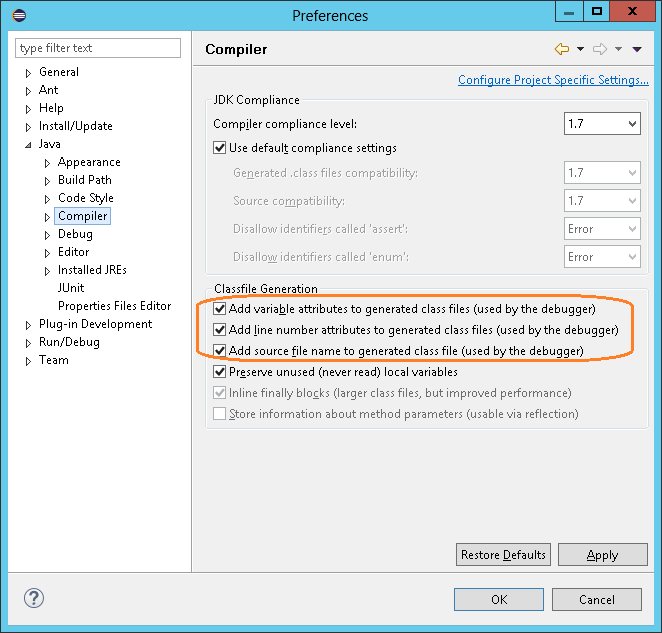
Now, open the Java project with the source code in Eclipse, and set the desired breakpoints:

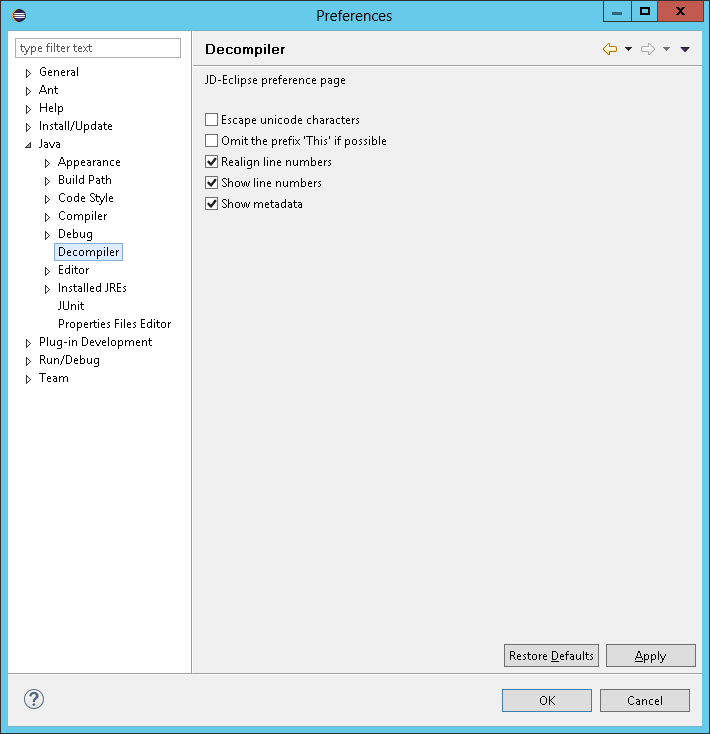
When you compiled the source code, verify that the Compiler Preferences included the debugging options:

Now, go to the Debug Configuration, set the port number, and click Debug:

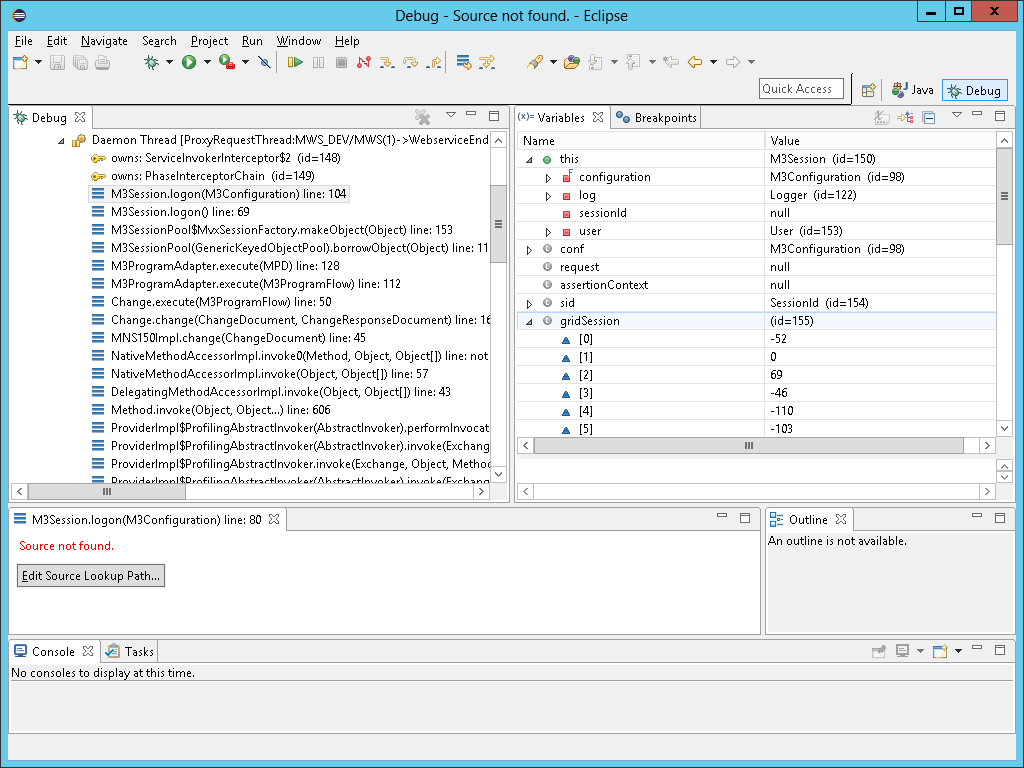
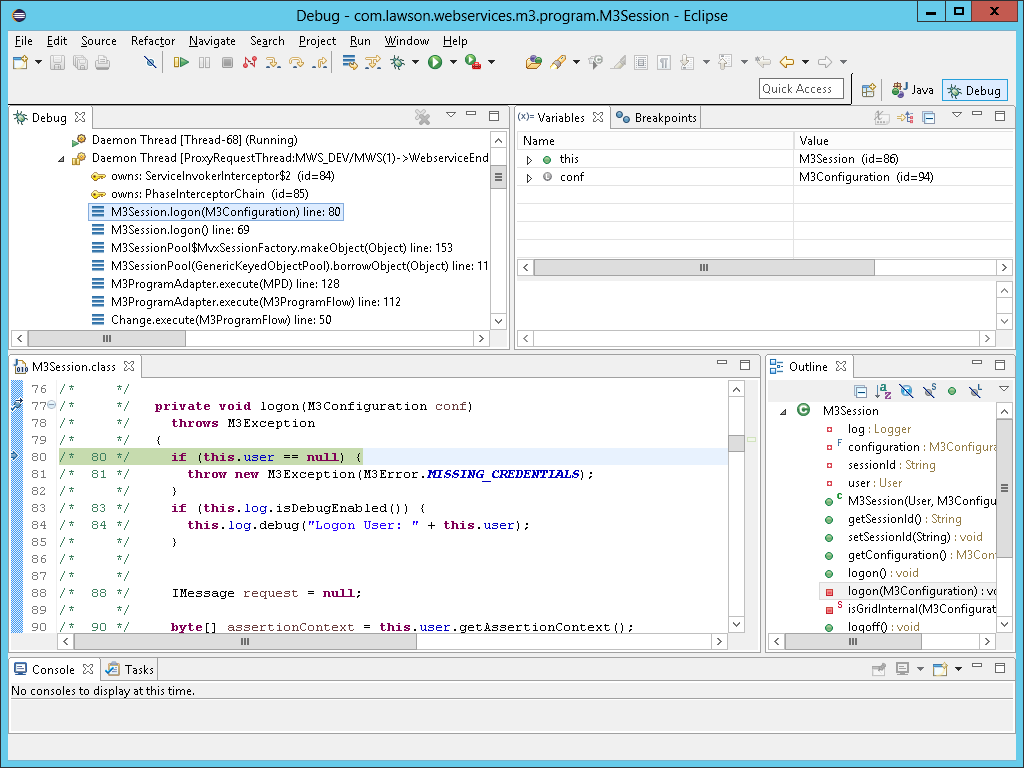
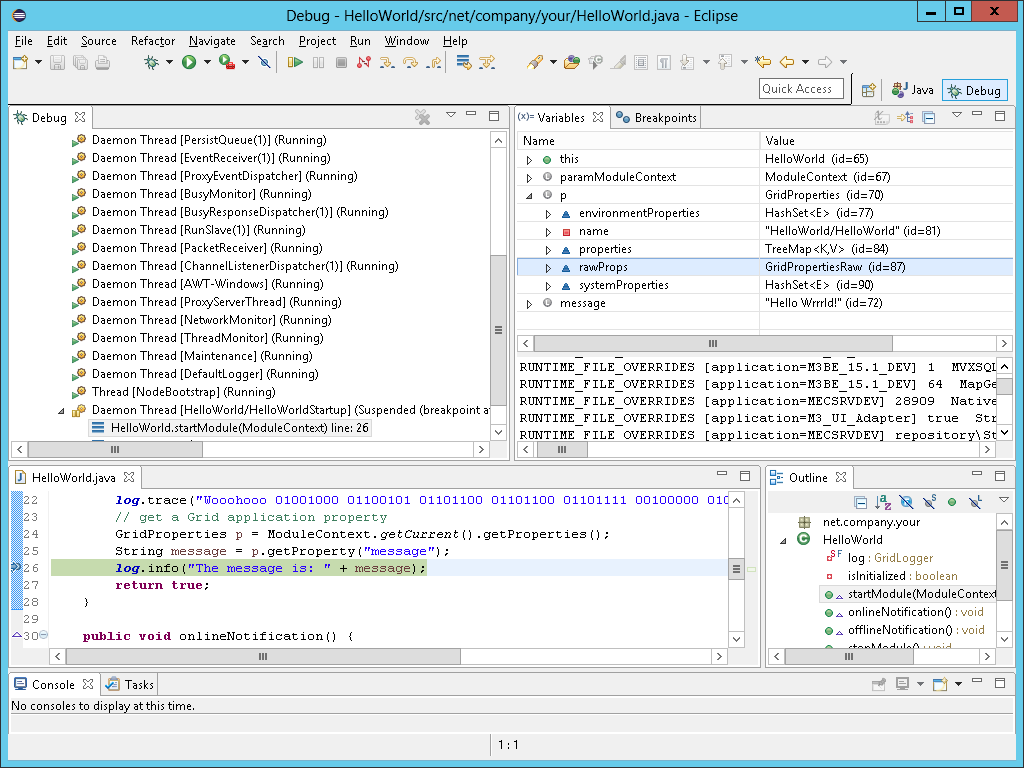
The debugger will attach to the remote Java VM, and will show the current threads:

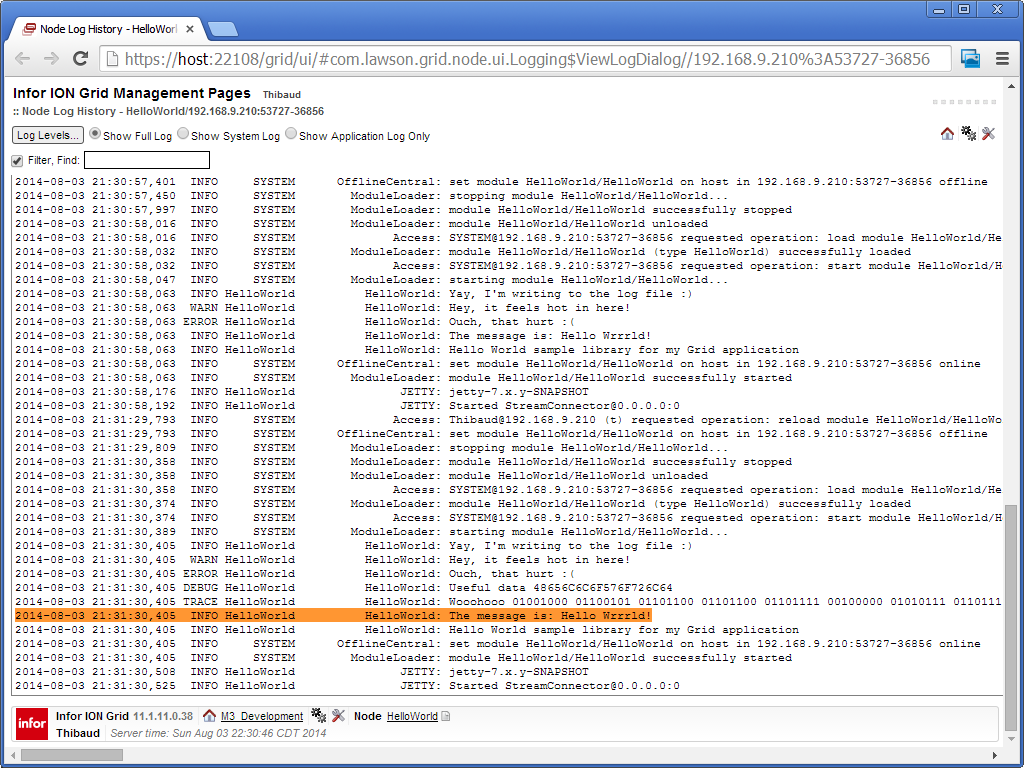
Now, reload the Module so we reach our breakpoints:

Finally, the debugger will reach our breakpoints, and now we can introspect the variables, step through the code, and so on:

Conclusion
That was an illustration of how to remotely debug an Infor Grid application at runtime with the Java Debugger and Eclipse. This is useful for learning, development and troubleshooting.
Note that when the Grid application threads are suspended the Node will show as status NOK_STALE, and unexpected consequences might happen in the Grid, such as timeouts or attempts to recover.
Also, remember this technique is not official and untested as we are still learning how to deal with Infor Grid applications.
That’s it! Please thumbs up if you like this, share around you, follow this blog, sign the petition, and author the next article.