Here is an illustrated example of how to use the Java Debugger in Eclipse to debug an existing Infor Grid application at runtime for which we don’t have the source code; for example I will debug the M3 Web Services (MWS) server, line by line, while I make a SOAP request.
For that, I will use the technique I learned in my previous post, Hacking Infor Grid application development (part 6), where I learned how to use the Java Debugger for my own Grid application for which I had the source code, and I will extend that technique to an existing Infor Grid application for which I don’t have the source code but for which I have the JAR files.
I had to learn this technique in order to troubleshoot a timeout issue we are currently having in MWS when making a SOAP request. This helped me pinpoint the modules, packages, classes, methods and lines of code that were at cause and report the results to Infor Support so they can report them to Infor Product Development for help. To that effect, please join the campaign and sign the petition asking Infor Product Development to make their source code available so we can better troubleshoot issues and learn. Also, this week is Open Access Week and it’s a great opportunity to ask Infor to make more of their documentation available.
Logging and DEBUG level
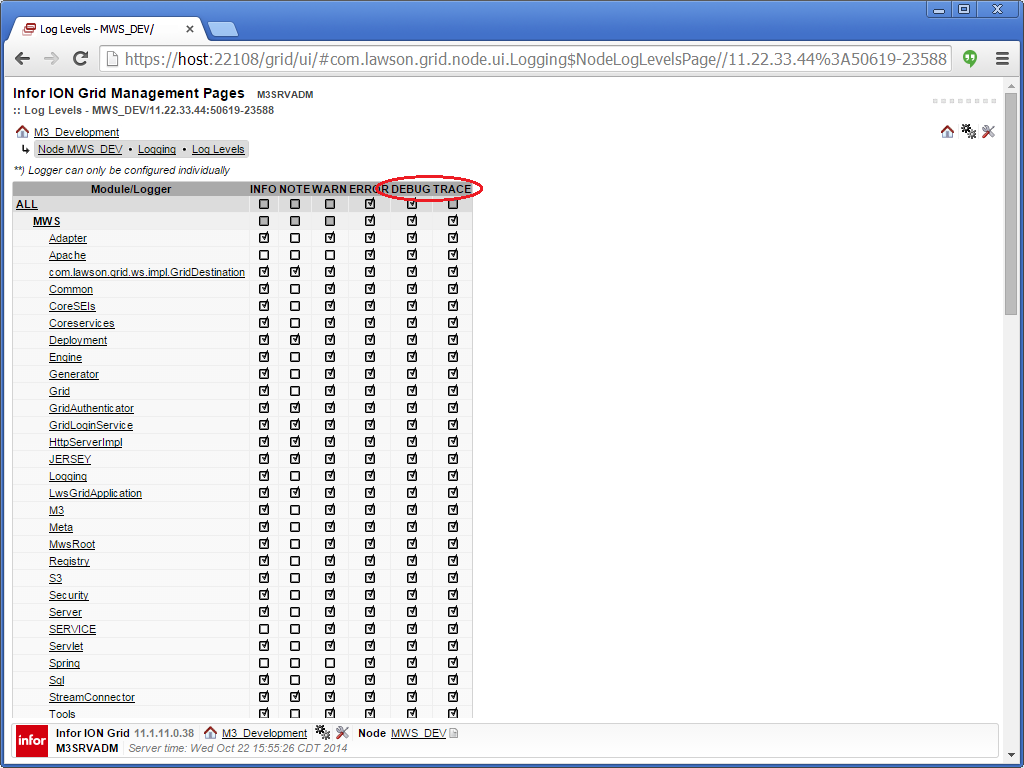
In order to narrow down the search space for the issue I was troubleshooting, I increased the log level of the application’s node to DEBUG level. In my case, I selected ALL modules: SYSTEM and MWS. I had also selected TRACE but it didn’t produce any log.
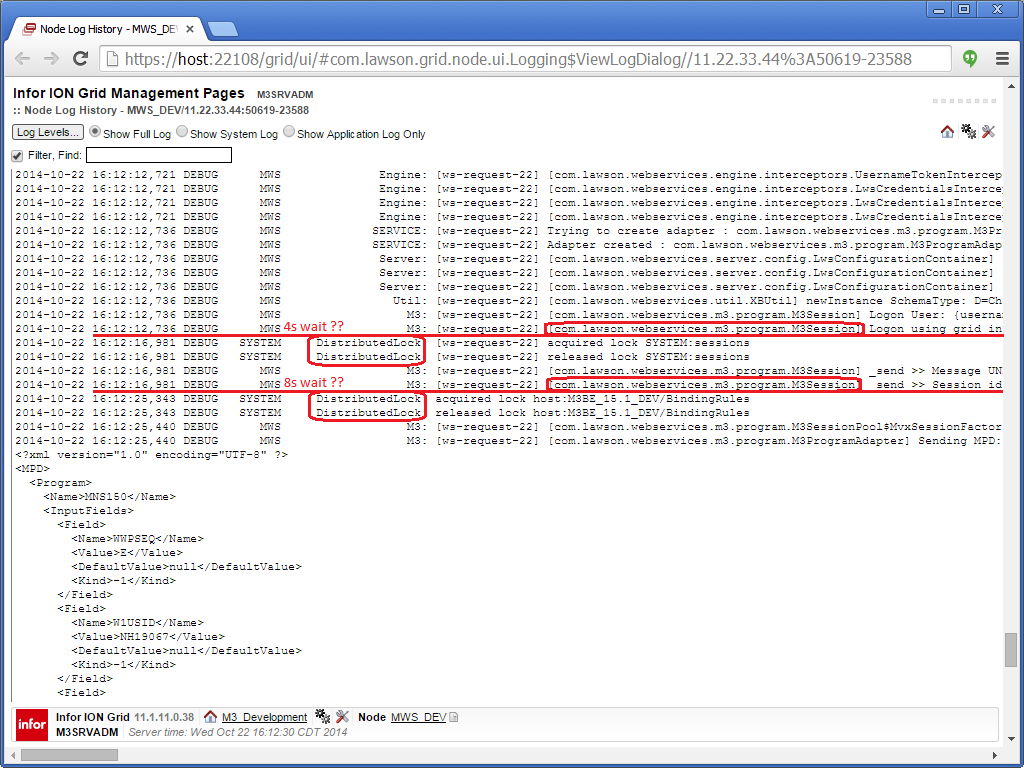
I then opened the log file and found interesting information about the bottleneck issue, that helps me narrow down which modules, packages, and classes to debug. In my case they are: MWS com.lawson.webservices.m3.program.M3Session, and SYSTEM DistributedLock:
Remember to revert the log level changes after you’re done to avoid clogging the disk space with increasing log.
Setup the Java Project in Eclipse
Let’s setup a new Java Project in Eclipse with the JAR files of the Infor Grid application (e.g. MWS in my case). For that:
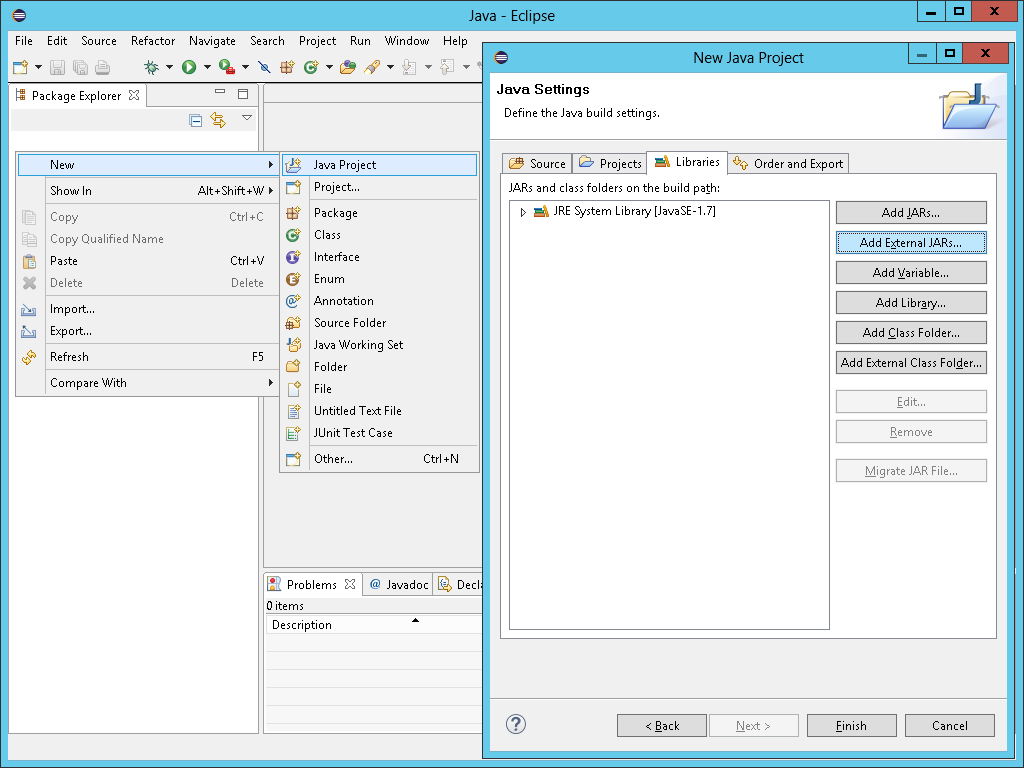
- Create a new Java Project in Eclipse, give it a name, and select Add External JARs:

- Select the JAR files of the Infor Grid application in LifeCycle Manager (e.g. MWS\lib\*.jar in my case):

- Optionally, you can also add the JAR files of the Grid runtime (grid-core.x.y.z.jar, etc.).
- Open the desired Java class (double-click), Eclipse will open that class in the Class File Editor, and for now it will say “Source not found”, we will fix that later:


Start debugging
Now let’s debug the application, even without the source code:
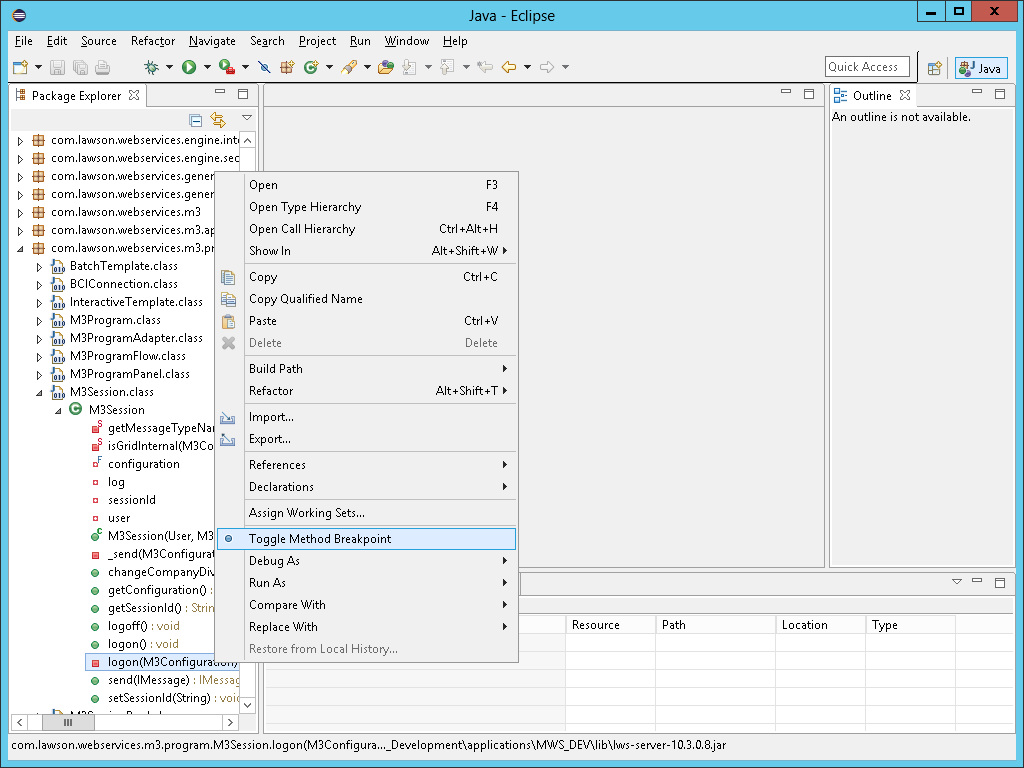
- Toggle the breakpoints at the desired methods:

- Prepare the Infor Grid application for debugging as detailed in my previous post:

- Start debugging in Eclipse:

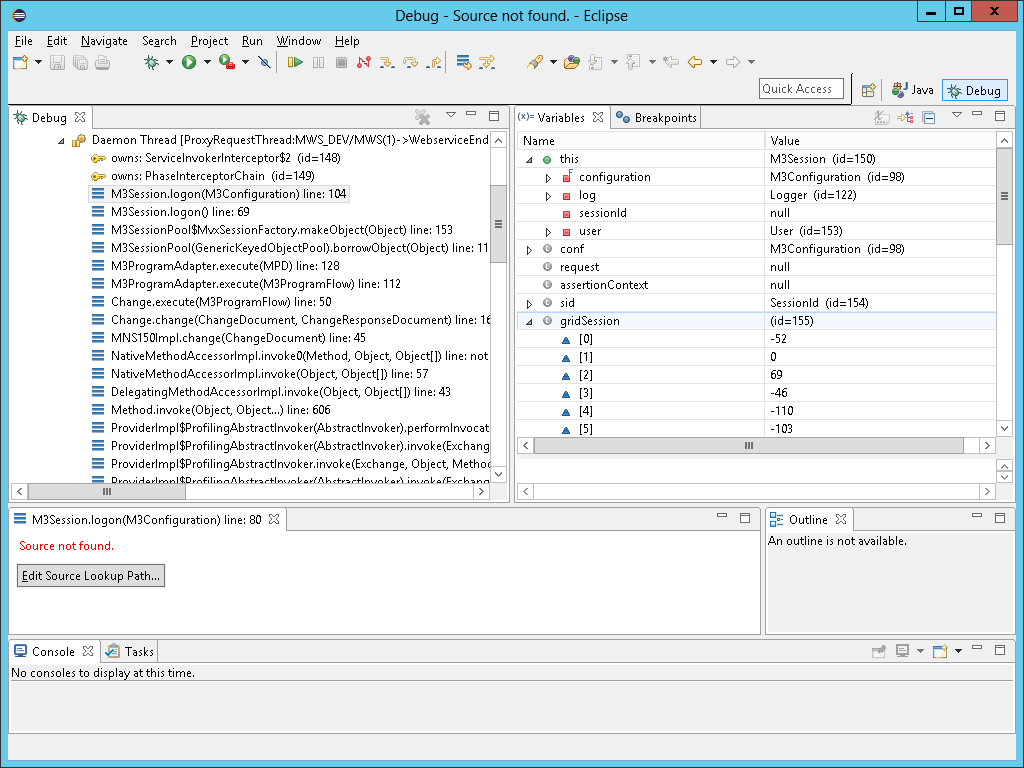
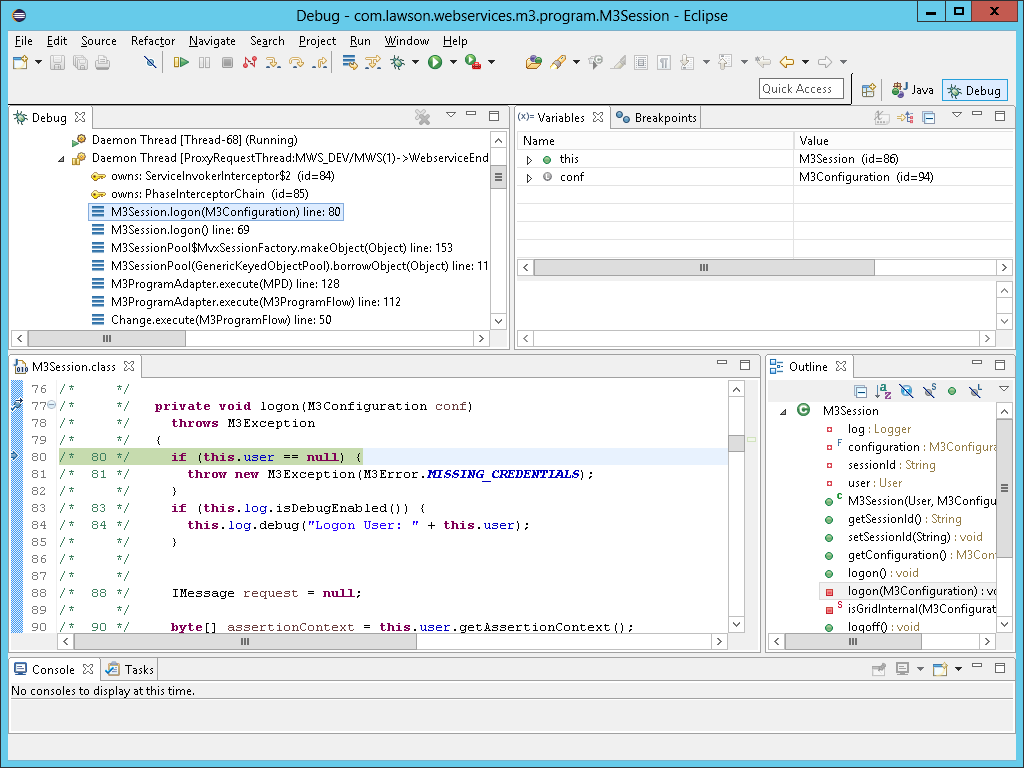
- Make the application go through your breakpoint (in my case I make a SOAP request, the application will call M3Session.logon, and Eclipse will suspend at my breakpoint).
- At this point, even without the source code, you can use the debugger as usual, to execute line by line, inspect variables, evaluate expressions, etc.; each class will show “Source not found” for now:


Add the Java decompiler
Now let’s use a Java decompiler for Eclipse to recover the source code (not the original source code though) and attach it to the classes.
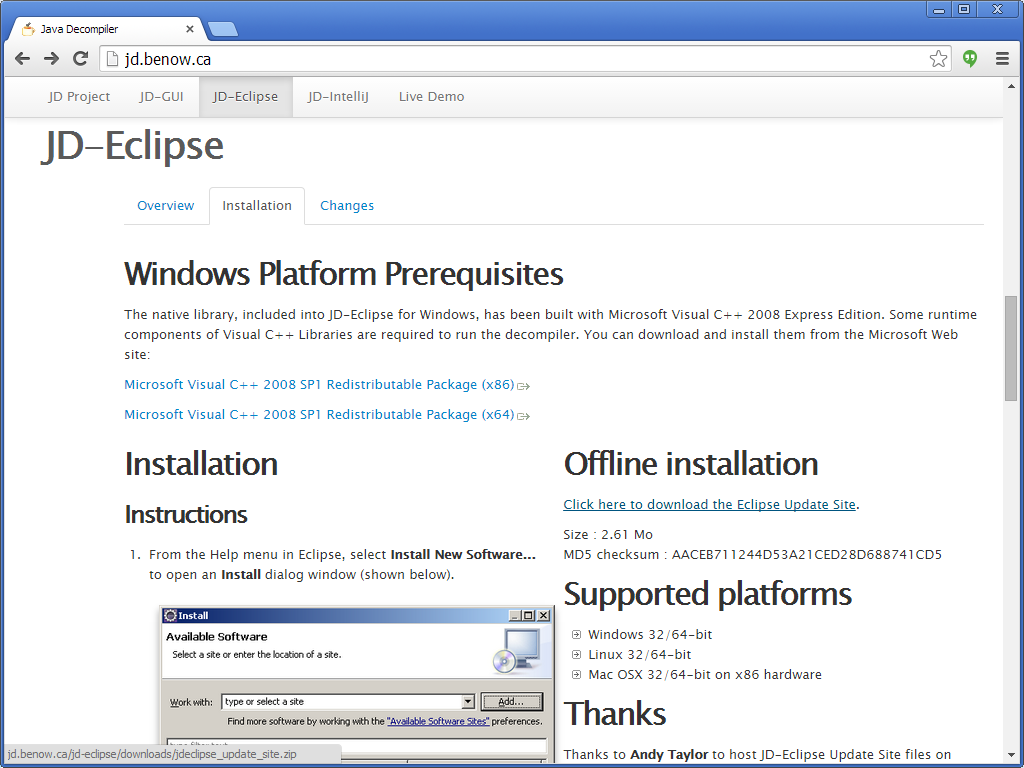
- I installed the JD-Eclipse plugin by Emmanuel Dupuy:

- JD-Eclipse will change the file association in Eclipse to open class files that don’t have source, decompile them, and attach the decompiled source back to the class:

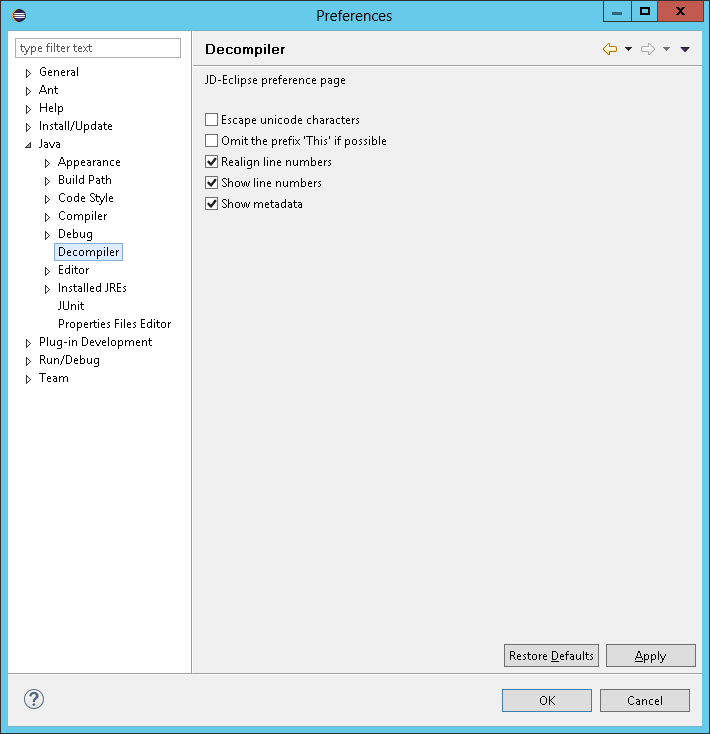
- Also, JD-Eclipse will realign the line numbers of the recovered source code so they match with the debug information of the class, otherwise the debugger will show the wrong lines of source code and it will be very confusing:

- Now open a class file (double-click) and JD-Eclipse will show the recovered source code with line numbers realigned:

- Now debug again with the breakpoints. This time the debugger will show the source code. This is the ideal scenario for debugging line by line:


Problem
I realized that as I’m debugging, JD-Eclipse will not decompile classes which it hasn’t previously decompiled. So if the debugger steps through a class that hasn’t been previously decompiled, the debugger will show the usual “Source not found”.
The workaround is to open all the classes we need the source code for, prior to debugging, one by one, so JD-Eclipse can decompile them, and attach the source code back to the class, and then we can try debugging again.
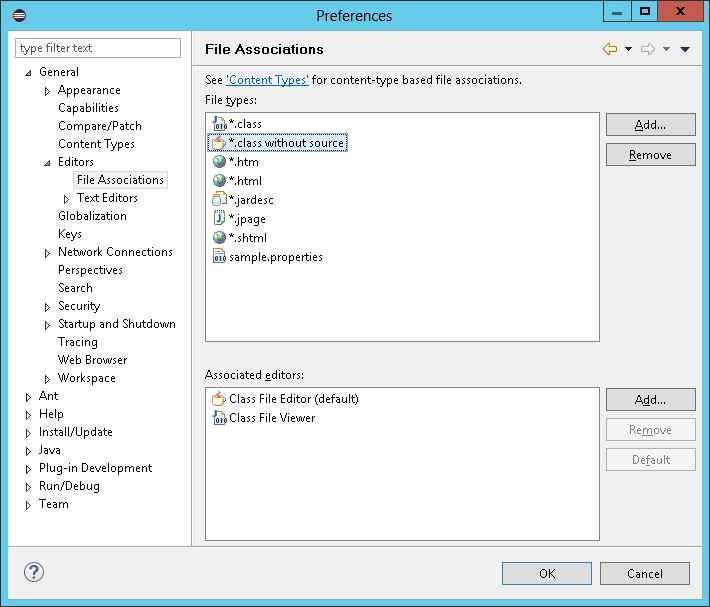
UPDATE 2014-10-29: That is not true anymore, and I found the solution: we have to change the default file association for the *.class files in order to use Java Decompiler’s Class File Editor, and we must do so every time we start Eclipse because Eclipse will revert to the default Class File Viewer when we exit Eclipse:

Future work: batch decompilation with realignment
I tried the plugin Realignment for JD-Eclipse by Alex Kosinsky that does batch decompilation, but it doesn’t realign the line numbers, so that doesn’t work. I also tried the plugin JDEclipse-Realign by Martin “Mchr3k” Robertson, it does decompile, and it does realign the line numbers, but I couldn’t get the source code to show while debugging, even after having previously decompiled the class, and I don’t know if it does batch decompilation.
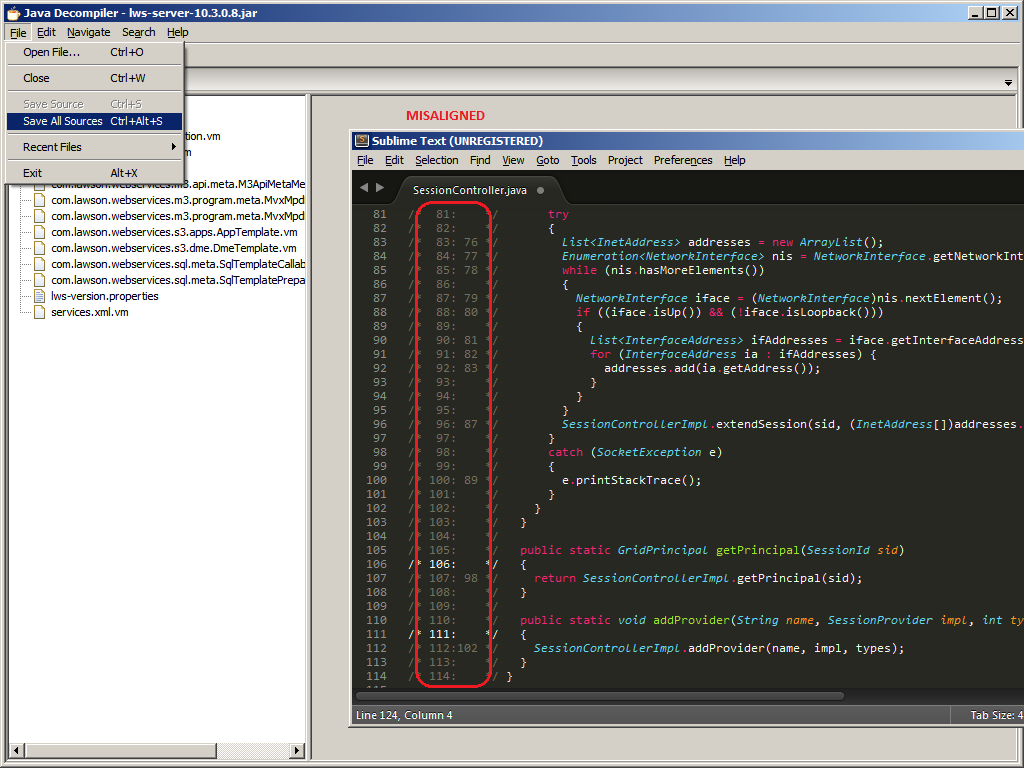
UPDATE 2014-10-29: Also, I tried Java Decompiler’s > Save All Sources, but it doesn’t realign the line numbers, even though JD-Core’s change log for version 0.7.0 says “Added an algorithm to realign the decompiled source code to the original line numbers”:
That’s future work to solve.
Summary
That was an illustrative guide of how to do Java debugging on an Infor Grid application, at runtime, without having the source code of the application, having just the JAR files from LifeCycle Manager. This technique helped my troubleshoot an issue with MWS. I hope it will help you too.
That’s it! If you learned something, please click Like below, click Follow to receive notifications about new blog posts, share around you, sign the petition, and write the next blog post with me, you are great. Thank you.

2 thoughts on “Java Debugging an Infor Grid application at runtime”