Here is an idea to manually create color-coded event graph animations for Mashups leveraging my previous tool that automatically generates event graphs for Mashup. The idea is to color-code the events in the event graph of a Mashup, and move forward in time to see the animation, in order to have a visual cue of how the Mashup timeline works. See it like a time-lapse of the Mashup.
Let’s take the sample Mashup provided at Mashup Designer > Help > M3 Transactions > List & edit Customers. The sequence of events of that Mashup would be the following:
- The Mashup starts and loads the list of customers (Startup event).
- Optionally, the user can enter a Customer number and click Search (Click event).
- The user selects a customer in the list (CurrentItemChanged event), and the Mashup loads that customer’s details.
- Optionally, the user changes the values and clicks Save (Click event), and the Mashup changes the values of that customer record.
- The Mashup refreshes the list of customers (UpdateComplete event).
The event graph for this Mashup in plain black & white would be:

The idea is to create a color-coded graph of each step of the sequence, save a colored image of each step, and render the result as an animated GIF.
Why it’s important
Color-coded event graph animations for Mashups will help developers control the quality of their Mashups, it will help users approve Mashup designs, it will be useful as a prototype for demos and useful for usability testing, and it will help new developers better understand how the user interacts with the Mashup. There is a lot of activity in the software industry around software mockups, for example the popular Balsamiq Mockups. This new idea I introduce for Mashups helps bring software mockups a bit closer to M3.
How to create it
Follow these steps to manually create a color-coded event graph animation for Mashups:
- Break down the sequence of Mashup events in numbered order, like I did above.
- Take the original DOT file of the event graph (refer to my previous tool), and duplicate the file by as many steps, for example MyMashup.gv would become:
MyMashup1.gv
MyMashup2.gv
MyMashup3.gv
etc. - Open each file in a text editor, and add color to the node and the edges involved in that step. Use the following syntax, for example for color red:
[color=red; fontcolor=red]
MyMashup1.gv:
<Global> -> CustomerList [label="Startup :: List"; color=red; fontcolor=red];
<Global> [color=red; fontcolor=red];
CustomerList [color=red; fontcolor=red];
MyMashup2.gv:
ButtonSearch -> CustomerList [label="Click :: List"; color=red; fontcolor=red];
ButtonSearch [color=red; fontcolor=red];
CustomerList [color=red; fontcolor=red];
MyMashup3.gv:
CustomerList -> CustomerDetail [label="CurrentItemChanged :: Get"; color=red; fontcolor=red];
CustomerList [color=red; fontcolor=red];
CustomerDetail [color=red; fontcolor=red];
etc.
- Use Graphivz to generate an output file of each step. For example you will have:
MyMashup1.png

MyMashup2.png

MyMashup3.png

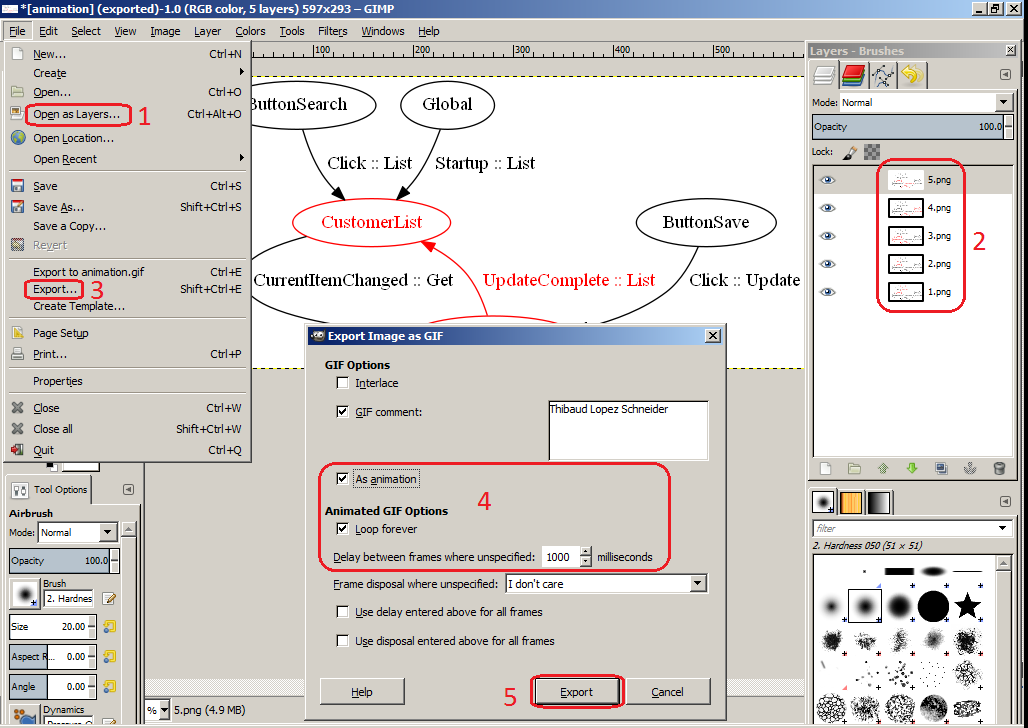
etc. - Use a graphic editor like Gimp to generate a GIF animation from the individual image files. In GIMP, open all the images as Layers, order the layers from last to first, and export the result as an animated GIF with 1000 millisecond delay between frames:

- That’s it!


Result
Here below is the result, a color-coded animation of the event graph of the sample List & edit Customer Mashup of the Mashup Designer (click on the image to see the animation):
Future work
In a future work, I would implement a breadth-first search graph traversal algorithm to automatically traverse the Mashup’s event graph, node by node, call Graphiz’ dot layout engine (C:\Program Files (x86)\Graphviz x.y.z\bin\dot.exe) to produce an image at each iteration, and use another tool to merge all the images into an animated GIF.

2 thoughts on “Color-coded event graph animations for Mashups”