FYI. Finally, I just attended the official Smart Office SDK training in Stockholm, long after I first saw it and played with it five years ago in Chicago. It was a long wait as I didn’t have a chance to work with it until now. It was worth the wait. Expect to see me write more posts about it to complement PotatoIT’s series and Karin’s series on the subject. If you don’t yet know the Smart Office SDK, it’s Mashups and Scripts on steroids. With it, we can produce more advanced solutions for M3 in Smart Office, beyond what Mashups and Scripts can offer. More soon.
Author: thibaudatwork
ex- M3 Technical Consultant
Google I/O 2013
I’m going to Google I/O 2013, the annual Google developer’s conference in San Francisco. Today I got an early bird ticket as an ION. Ping me if you go. See you there!
OptiMap_V2
Here is the second version of the OptiMap script for Smart Office that integrates the Delivery Toolbox – MWS410/B with OptiMap – Fastest Roundtrip Solver to calculate and show on Google Maps the fastest roundtrip for the selected Routes. This extends the first version of the script.
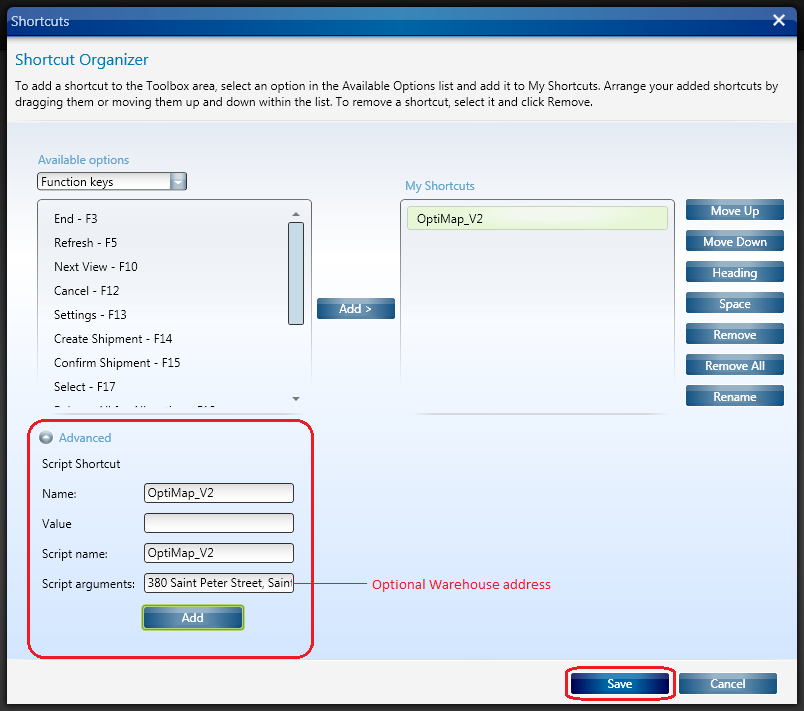
In this second version I added the possibility to set the starting address (for example the Warehouse) as the Script argument. See lines 52-54.
import System;
import System.Web;
import System.Windows;
import Mango.UI.Services.Lists;
import MForms;

/*

	OptiMap_V2 for M3
	Thibaud Lopez Schneider, Infor, October 19, 2012 (rev.2)

	This script illustrates how to integrate the Smart Office Delivery Toolbox - MWS410/B with OptiMap - Fastest Roundtrip Solver, http://www.optimap.net/
	to calculate and show on Google Maps the fastest roundtrip for the selected Routes; it's an application of the Traveling Salesman Problem (TSP) to M3.
	This is interesting for a company to reduce overall driving time and cost, and for a driver to optimize its truck load according to the order of delivery.

	To install this script:
	1) Deploy this script in the mne\jscript\ folder of your Smart Office server
	2) Create a Shortcut in MWS410/B to run this script; for that go to MWS410/B > Tools > Personalize > Shortcuts > Advanced > Script Shortcut, set the Name to OptiMap, and set the Script name to OptiMap
	3) Optionally, set the starting address (for example the Warehouse) as the Script argument; the address must be recognized by Google Maps
	4) Create a View (PAVR) in MWS410/B that shows the address columns ADR1, ADR2, ADR3

	To use this script:
	1) Start MWS410/B
	2) Switch to the View (PAVR) that shows the address columns ADR1, ADR2, ADR3
	3) Select multiple Routes in the list (press CTRL to select multiple rows)
	4) Click the OptiMap Shortcut
	5) The Shortcut will run the script, the script will launch OptiMap in a browser and pass the selected addresses as locN parameters in the URL, and OptiMap will optimize the roundtrip

	For more information and screenshots refer to:
	https://thibaudatwork.wordpress.com/2012/10/04/route-optimization-for-mws410-with-optimap/
	https://thibaudatwork.wordpress.com/2013/03/08/optimap_v2/

*/
package MForms.JScript {
	class OptiMap_V2 {
		public function Init(element: Object, args: Object, controller : Object, debug : Object) {
			try {
				// get a reference to the list
				var listControl: MForms.ListControl = controller.RenderEngine.ListControl;
				var listView: System.Windows.Controls.ListView = controller.RenderEngine.ListViewControl;
				if (listControl == null || listView == null) { MessageBox.Show('Error: Couldn\'t find the list.'); return; }
				// get the selected rows
				var rows = listView.SelectedItems; // System.Windows.Controls.SelectedItemCollection
				if (rows == null || rows.Count == 0) { MessageBox.Show('Error: Select multiple routes in the list (press CTRL to select multiple rows).'); return; }
				// get the address columns ADR1, ADR2, ADR3
				var column1: int = listControl.GetColumnIndexByName('ADR1');
				var column2: int = listControl.GetColumnIndexByName('ADR2');
				var column3: int = listControl.GetColumnIndexByName('ADR3');
				if (column1 == -1 || column2 == -1 || column3 == -1) { MessageBox.Show('Error: Couldn\'t find the address columns ADR1, ADR2, ADR3.'); return; }
				// construct the URL
				var query: String = 'http://www.optimap.net/?';
				// set the optional starting address
				var offset: int = 0;
				if (!String.IsNullOrEmpty(args)) { offset=1; query += 'loc0=' + HttpUtility.UrlEncode(args) + '&'; }
				// add the selected addresses
				for (var i: int = 0; i < rows.Count; i++) {
					var row: ListRow = rows[i];
					var ADR1: String = row[column1];
					var ADR2: String = row[column2];
					var ADR3: String = row[column3];
					var address: String = ADR1 + ',' + ADR2 + ',' + ADR3;
					query += 'loc' + (i+offset) + '=' + HttpUtility.UrlEncode(address) + '&';
				}
				// launch OptiMap in a browser
				ScriptUtil.Launch(new Uri(query));
			} catch (ex: Exception) {
				MessageBox.Show(ex);
			}
		}
	}
}
Here is a screenshot of how to set the address as an Argument of the script:
That’s it!
(Oh, and I finally learned how to post source code to WordPress. Duh!)
Related Articles
Google Glass
I just applied to get a pair of Google Glass.
Google Glass is an anticipated product from Google X for bringing Augmented Reality to the masses in a sports fashion pair of glasses containing a video camera, a Heads-Up Display, a processing unit running Android, Wifi connectivity, and a battery (c.f. the patent).
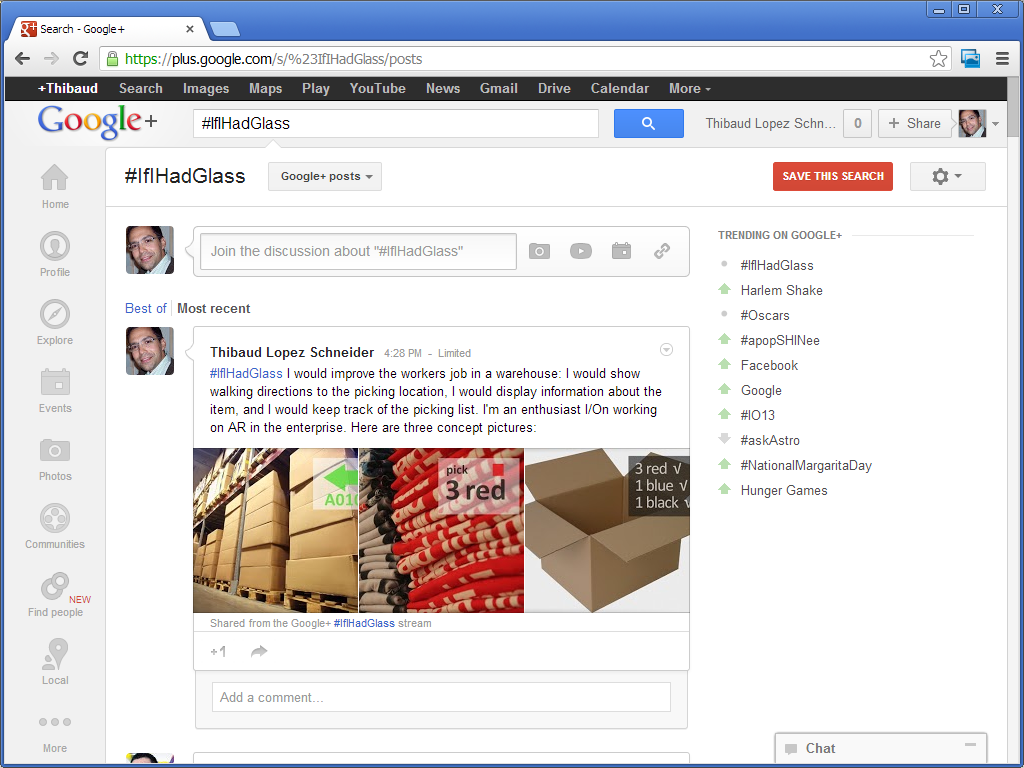
I was at Google I/O 2012 were they accepted pre-orders for Glass Explorer Edition but I made the regretful decision to not apply. Google is now offering a second chance: What would you do if you had Glass? Answer with #ifihadglass.
If I had Glass I would improve the workers job in a warehouse: I would show walking directions to the picking location, I would display information about the item, and I would keep track of the picking list. I’m an enthusiast I/On working on AR in the enterprise.
This would be a continuation of my previous implementation of Augmented Reality for M3.
Here are my three concepts pictures for Google Glass:


Here’s my application:
Wish me luck, and see you at Google I/O 2013.
New M3 blog by Sherman
Our community is glad to welcome a new M3 blog, Sherman’s M3 Ideas, http://jwsassoc.wordpress.com/ . Sherman’s first post is: “Finding a column field name in an M3 LSO list panel using a script”. I invite you to subscribe to his blog, subscribe to my blog, and check out my Links page to find more blogs. Let’s keep this community growing 🙂
M3 + Augmented Reality
In this article I introduce the first implementation that I know of Augmented Reality for Infor M3. Augmented Reality is the ability to superpose digital information on top of real world objects. This is achieved by locating the user’s head in space, by determining the user’s point of view, by registering real world objects, and by projecting virtual 3D objects accordingly. Implementing it has been a deer dream of mine. In this example I use fiducial markers and data coming from Item Master – MMS001.

Applications
Augmented Reality for M3 could be used for many applications. For example, it could help a worker find an Item in the warehouse by showing optimized walking directions and distance to possible picking locations. Also, it could help a worker show contextual information at a glance.
I believe Augmented Reality to be a disruptive technology and one of the next big revolutions in the software industry, with positive impacts similar to those of the Internet and mobile devices, that will reshape entire industries in the next 10 years.
Timeline & motivation
In 1998 I got a summer job in a warehouse for a company that sold car brakes. Every few minutes a printer spit out a picking list of items that I had to collect. As a temporary worker unfamiliar with the place, I spent most of my time wandering through the warehouse, searching for the items, and asking the more seasoned workers for help; I found that inefficient and I wished the computer gave me a map with directions of where to go. Also, the picking lists were un-ordered and I often had to go back to a previous location I had just visited; I found that inefficient and I wished the computer optimized the picking lists. Also, once I found the location, I often discovered the boxes were empty and I had to ask a forklift driver to replenish the stock location from a box of a higher shelf; I found that inefficient and I wished the computer planned replenishment ahead of time. That was in 1998 and nowadays ERP and Warehouse management systems are more common. Yet, I kept my wish to make better systems.
Then, In 2001 I read about Professor Steven Feiner’s Augmented Reality KARMA project from 1992 at Columbia University. The system fit in a backpack and had portable computer, batteries, GPS, compass, and head-mounted display. It would give detailed instructions to a user on how to repair a printer. That was my first exposure to Augmented Reality and ever since I have been wanting to implement it.
In 2007 Apple introduced the iPhone, with a stunning user interface, graphics, and processing power, blowing everybody’s mind about mobility and redefining an industry. And in 2009 Apple added a camera to the iPhone 3GS. The hardware technology for Augmented Reality started becoming accessible to the masses.
In 2009 I met with Brad Neuberg of Google at the Google I/O conference and I started working on a client-side search engine for M3 source code. That was my first exposure to HTML5.
In 2010 I implemented my first Warehouse 3D demo using Google Earth, with real data fed from the ERP, and I projected the result on a large touch screen for an immersive experience. That was my first step towards implemented Augmented Reality for M3.
In 2011 I proposed an idea for an internal project for M3 + Augmented Reality on mobile devices.
In parallel, WHATWG and W3C have been working hard to standardize HTML5 with the ability to use the webcam in JavaScript with WebRTC, to access pixel data, to paint on the canvas, and to use WebGL for 3D rendering. The software technology for Augmented Reality is becoming accessible to the masses.
More recently I started working on geo-locating Stock Locations in M3. This opens the door to new applications for geo-coded data in M3.
Then, at the Google I/O conference this year, I met with Ilmari Heikkinen whom pointed me to his article in HTML5 Rocks on Writing Augmented Reality Applications using JSARToolKit. That was the last push I needed to implement actual Augmented Reality for M3. So I did.
Implementation
I used Ilmari’s source code and I added a few lines of code to call an M3 API using REST in JavaScript when a marker is detected. In this example, the marker is mapped to an Item number (ITNO), but it could also be mapped to a Stock Location (WHSL) for example. Then, for that Item number I call the M3 API MMS200MI.GetItmBasic and I display the Name (ITDS), Description (FUDS), Basic unit of measure (UNMS), Volume (VOL3), Net weight (NEWE), Gross weight (GRWE).
Result
Here is a video of the result. Note the section below the canvas that shows M3 data coming from MMS200MI.GetItmBasic for the detected marker. We can see an activity indicator flickering as the markers are detected. For best viewing, watch the video in YouTube, in HD, and in full screen.
Source code
I provide the result for download at http://ibrix.info/ar/demo.zip with HTML and JavaScript source code, sample fiducial markers, and sample images.
Future work
With the simple example I introduced in this article I illustrate that hardware and software technology for Augmented Reality have have already become accessible for the masses. The technology is still maturing. There are on-going projects to provide registration without the use of markers. Also, sensors are becoming better for indoor location.
That’s it for now.
Please click ‘Follow’ to subscribe to my blog.
Route optimization for MWS410 with OptiMap
Here is a script for Lawson Smart Office that integrates the Delivery Toolbox – MWS410/B with OptiMap – Fastest Roundtrip Solver to calculate and show on Google Maps the fastest roundtrip for the selected Routes. It’s a solution to the Travelling salesman problem (TSP) for M3 Routes.
This is interesting for a company to reduce overall driving time and cost, and it’s interesting for a driver to optimize its truck load according to the order of delivery.
To solve the TSP on Google Maps, the authors of OptiMap implemented several algorithms, including brute force, nearest-neighbor, and the Ant Colony Optimization, and released the code for the TSP Solver for Google Maps API as open source with an MIT License. Because the TSP is an NP-complete problem the solution only works well for up to 10 cities on current desktop computers. But OptiMap can apparently solve more than 15 cities. You can read more about OptiMap at Behind the Scenes of OptiMap and OptiMap version 4 is here.
To integrate OptiMap with Smart Office I wrote a simple Personalized Script that gets the addresses of the selected Routes in MWS410/B, and that opens OptiMap in a web browser with the delivery addresses in the URL. The GET parameters are explained in OptiMap’s Optimize Your Trips.
Setup
To install and use the script:
- Deploy this script in the
mne\jscript\folder in your Smart Office server:

- Create a Shortcut in MWS410/B to run this script; for that go to MWS410/B > Tools > Personalize > Shortcuts > Advanced, expand Script Shortcut, set the Name to OptiMap, set the Script name to OptiMap, click Add, and click Save:

- Create a View (PAVR) in MWS410/B that shows the address columns ADR1, ADR2, ADR3:

- Select multiple Routes in the list (press CTRL to select multiple rows), and click the OptiMap Shortcut to run the script:


Result
The script will launch OptiMap for the selected Routes, and OptiMap will optimize the order of delivery:

Source code
Here is the complete source code for the script:
import System;
import System.Web;
import System.Windows;
import Mango.UI.Services.Lists;
import MForms;

/*
Integrates the Smart Office Delivery Toolbox - MWS410/B with OptiMap - Fastest Roundtrip Solver, http://www.optimap.net/
to calculate and show on Google Maps the fastest roundtrip for the selected Routes.
This is interesting to reduce driving time and cost, and for a driver to optimize its truck load according to the order of delivery.
1) Deploy this script in the mne\jscript\ folder in your Smart Office server
2) Create a Shortcut in MWS410/B to run this script; for that go to MWS410/B > Tools > Personalize > Shortcuts > Advanced > Script Shortcut, set the Name to OptiMap, and set the Script name to OptiMap
3) Create a View (PAVR) in MWS410/B that shows the address columns ADR1, ADR2, ADR3
4) Select multiple Routes in the list (press CTRL to select multiple rows)
5) Click the OptiMap Shortcut to run this script and launch OptiMap for the selected Routes
For more information and screenshots refer to https://thibaudatwork.wordpress.com/2012/10/04/route-optimizer/
Thibaud Lopez Schneider, Infor, October 4, 2012 (rev.2)
*/
package MForms.JScript {
    class OptiMap {
        public function Init(element: Object, args: Object, controller : Object, debug : Object) {
            try {
                // get the list
                var listControl: MForms.ListControl = controller.RenderEngine.ListControl;
                var listView: System.Windows.Controls.ListView = controller.RenderEngine.ListViewControl;
                if (listControl == null || listView == null) { MessageBox.Show('Error: Couldn\'t find the list.'); return; }
                // get the selected rows
                var rows = listView.SelectedItems; // System.Windows.Controls.SelectedItemCollection
                if (rows == null || rows.Count == 0) { MessageBox.Show('Error: No rows selected.'); return; }
                // get the address columns ADR1, ADR2, ADR3
                var column1: int = listControl.GetColumnIndexByName('ADR1');
                var column2: int = listControl.GetColumnIndexByName('ADR2');
                var column3: int = listControl.GetColumnIndexByName('ADR3');
                if (column1 == -1 || column2 == -1 || column3 == -1) { MessageBox.Show('Error: Couldn\'t find the address columns ADR1, ADR2, ADR3.'); return; }
                // construct the URL
                var query: String = '';
                for (var i: int = 0; i < rows.Count; i++) {
                    var row: ListRow = rows[i];
                    var ADR1: String = row[column1];
                    var ADR2: String = row[column2];
                    var ADR3: String = row[column3];
                    var address: String = ADR1 + ',' + ADR2 + ',' + ADR3;
                    query += 'loc' + i + '=' + HttpUtility.UrlEncode(address) + '&';
                }
                var uri: Uri = new Uri('http://www.optimap.net/?' + query);
                // launch OptiMap
                ScriptUtil.Launch(uri);
            } catch (ex: Exception) {
                MessageBox.Show(ex);
            }
        }
    }
}
That’s it!
Related posts
See also version OptiMap_V2.
Geocoding of Stock Locations in MMS010
Here is a video that illustrates the process to set the Geo Codes XYZ of Stock Locations in MMS010 in Smart Office, i.e. to set the latitude, longitude, and altitude of Stock Locations, a.k.a. geocoding. In my example I determined the coordinates based on an 3D model built in Google SketchUp and geo-located in Google Earth; a GPS receiver with good indoor accuracy would work as well. With geocoded information, we can present data from the Warehouse Management System in a graphical way. This is important for applications such as showing Stock Locations on a map, or finding the shortest path for a picking list.
Demo video
How to proceed
These are the steps I followed in the video to geolocate the Stock Locations in MMS010:
- I used this SketchUp model of a 3D warehouse that I had previously geo-located:

- I also used this other SketchUp model of the Stock Locations that I had previously uniquely identified:

- Then, I used this Ruby script to get the geocoding of the floor plan:

- Then, I used this other Ruby script to get the geocoding of each Stock Location:

- The result is this CSV file of the floor plan’s geocodes and each Stock Location’s geocodes:

- Then, I used this Lawson Web Service of type Display Program to set the values for the fields Geo Code X (GEOX), Geo Code Y (GEOY), and Geo Code Z (GEOZ) in MMS010/F for a specified Warehouse (WHLO) and Stock Location (WHSL):

- Then, I used a Visual Basic macro for Microsoft Excel to call the Web Service for all Stock Locations:

- Finally, I used this script to display the Geo Codes XYZ in MMS010/B1:


Result
The result is the list of Stock Locations in MMS010/B1 displaying all the Geo Codes XYZ:

Resources
- Download the SketchUp model of the geo-located 3D warehouse.
- Download the SketchUp model of the uniquely identified Stock Locations.
- Download the Ruby script to get the geocoding of the floor plan.
- Download the Ruby script to get the geocoding of each Stock Location.
- Download the resulting CSV file of all Stock Locations and their Geo Codes.
- Download the Lawson Web Service to set the Geo Codes XYZ of a Stock Location.
- Download the script to display the Geo Codes XYZ in MMS010/B1.
- Watch the video of the entire process.
Related articles
UPDATE
2012-09-28: I had a bug in the Ruby script that miscalculated the Y and Z geocodes for the Stock Locations. I corrected the script and the resulting CSV file and I updated the links above.
Custom Lists & Mashups
Here is a solution to add columns to a list of an M3 panel in Smart Office without doing any M3 Java modifications and without writing any scripts. The advantage is zero programming. In addition, this technique is interesting when it’s not possible to create custom Sorting Orders (QTTP) nor custom Views (PAVR) for an M3 program (for example Stock Location – MMS010). This technique uses a new feature of M3 called Custom Lists. To create custom lists you will need the Industry Enrichment Package IEP F09201M306 in MNS096.
In this example I will add three columns Geo code X, Y, and Z to the list of Stock Location – MMS010/B1. The values come from the fields GEOX, GEOY, and GEOZ of MMS010/F. This solution is an alternative to the solution of my previous post where I illustrated how to programmatically add columns to a list by writing a script.
Desired result
The desired result is the list Stock Location – MMS010/B1 with three new columns Geo code X, Y, and Z.

Custom List
To create this custom list I follow these steps:
- First, I create a new Information Browser Category in CMM310, GEOCODES in this example:

- Then, I create a new View in CMM315 where I include the desired new columns, MSGEOX, MSGEOY, and MSGEOZ in this example:

- Then, I simulate the list to select the columns to display and to select the order of the columns:

- Finally, I add the Custom List to a Mashup where List type = Custom:


Final result
The final result is a Mashup with Stock Location – MMS010 and three new columns Geo code X, Y, and X.

Conclusion
With the new IEP feature and with Mashups we can now create Custom Lists in M3 by configuration only, i.e. without any programming.
For more information
To learn this technique and more, refer to the Mashup Designer Advanced training (code SMMA2) from the Lawson Learning courses.
Related articles
- How to add a column to a list (continued), latest post on how to add columns to a list with a script
- How to add a column to a list, older post on how to add columns to a list with a script
How to add a column to a list (continued)
Here is a real example of how to add a column to a list in M3 using a Script for Smart Office. It’s an illustration of my previous post on the same subject, an implementation of what was discussed in the comments of the first post, and a continuation of Karin’s post.
In this example I will add three columns to the list of Stock Location – MMS010/B1 to display the Geographic codes X, Y, and Z, which correspond to the longitude, latitude, and altitude of a Stock Location in a Warehouse. The Geo codes are stored in MMS010/F.
Why it matters
The benefit of this kind of solutions is to avoid an M3 Java modification.
From a technical point of view, this example illustrates how to dynamically add content to an existing M3 panel, how to access the ListView’s new internals in Smart Office 10.x, how to call an M3 API, how to use a background thread, how to indicate activity in the UI thread while the background thread works, and how to use the ScrollViewer to load data at each page scroll.
Desired result
This is the desired result:

Source code
Here is the complete source code:
import System;
import System.Collections;
import System.Windows.Controls;
import System.Windows.Input;
import System.Windows.Media;
import Lawson.M3.MI;
import Mango.UI.Services.Lists;
import MForms;

/*
    Displays the Geo codes XYZ in MMS010/B1 in three new columns loaded by calling MMS010MI.ListLocations.
    Thibaud Lopez Schneider, Infor, 2012-09-27
*/
package MForms.JScript {
    class ShowGeoCodes {

        /*
            PENDING
            - Horizontal align the columns contents to the right
            - Vertical align the columns headers to top
            - Auto width the columns
        */
        var controller: Object, content: Object, debug: Object;
        var listView; // System.Windows.Controls.ListView
        var rows: System.Windows.Controls.ItemCollection;
        var columns: System.Windows.Controls.GridViewColumnCollection;
        var scrollViewer: System.Windows.Controls.ScrollViewer;
        var oldCount: int = 0, newCount: int = 0;
        var GeoCodes; // System.Collections.Generic.IList[Lawson.M3.MI.MIRecord]

        public function Init(element: Object, args: Object, controller : Object, debug : Object) {
            try {

                // global variables
                this.controller = controller;
                this.content = controller.RenderEngine.Content;
                this.debug = debug;
                this.listView = controller.RenderEngine.ListControl.ListView; // == controller.RenderEngine.ListViewControl
                this.rows = listView.Items;
                this.columns = listView.View.Columns;

                // append three new columns to the ListView
                var newColumns = ['Geo code X', 'Geo code Y', 'Geo code Z'];
                for (var i in newColumns) {
                    var gvch = new GridViewColumnHeader();
                    gvch.Content = newColumns[i];
                    var gvc = new GridViewColumn();
                    gvc.Header = gvch;
                    gvc.CellTemplateSelector = new ListCellTemplateSelector(columns.Count, controller.RenderEngine.ListControl.Columns);
                    columns.Add(gvc);
                }

                // register the ScrollChanged event of the ListView
                oldCount = newCount = rows.Count;
                var border = VisualTreeHelper.GetChild(listView, 0);
                var grid = VisualTreeHelper.GetChild(border, 0);
                this.scrollViewer = VisualTreeHelper.GetChild(grid, 3);
                this.scrollViewer.add_ScrollChanged(OnScrollChanged);

                // load the Geo codes XYZ by calling MMS010MI
                var CONO = UserContext.CurrentCompany;
                var WHLO = ScriptUtil.FindChild(content, 'WWWHLO').Text;
                BeginLoadGeoCodes(CONO, WHLO);

                // attach event to cleanup
                controller.add_RequestCompleted(OnRequestCompleted);

            } catch (ex: Exception) {
                debug.WriteLine(ex);
            }
        }

        /*
            Loads the Geo codes XYZ by calling MMS010MI.ListLocations.
        */
        function BeginLoadGeoCodes(CONO: int, WHLO: String) {
            controller.RenderEngine.ShowMessage('loading Geo codes...');
            content.Cursor = Cursors.Wait;
            var record = new MIRecord();
            record['CONO'] = CONO;
            record['WHLO'] = WHLO;
            var parameters = new MIParameters();
            parameters.OutputFields = ['WHSL', 'GEOX', 'GEOY', 'GEOZ'];
            parameters.MaxReturnedRecords = 0;
            MIWorker.Run('MMS010MI', 'ListLocations', record, EndLoadGeoCodes, parameters);
        }

        /*
            Handles the response from MMS010MI.ListLocations.
        */
        function EndLoadGeoCodes(response: MIResponse) {
            try {
                controller.RenderEngine.ClearMessage();
                content.Cursor = Cursors.Arrow;
                if (response.HasError) {
                    controller.RenderEngine.ShowMessage(response.ErrorMessage);
                } else {
                    this.GeoCodes = response.Items;
                    ShowGeoCodesXYZ(0, rows.Count-1);
                }
            } catch(ex: Exception) {
                debug.WriteLine(ex);
            }
        }

        /*
            Loads more rows on ScrollViewer.
        */
        function OnScrollChanged(sender: Object, e: ScrollChangedEventArgs) {
            try {
                if (e.VerticalChange != 0) {
                    oldCount = listView.Items.Count;
                } else {
                    var newCount = listView.Items.Count;
                    var diff: int = newCount - oldCount;
                    var fromRow = oldCount;
                    var toRow = listView.Items.Count - 1;
                    if (diff > 0) {
                        ShowGeoCodesXYZ(fromRow, toRow);
                    }
                }
            } catch (ex: Exception) {
                debug.WriteLine(ex);
            }
        }

        /*
            Shows the Geo codes XYZ for the specified rows.
        */
        function ShowGeoCodesXYZ(fromRow: int, toRow: int) {
            var rows = IList(listView.ItemsSource);
            for (var i = fromRow; i <= toRow; i++) {
                var WHSL = rows[i].Item[0];
                var codes = GetGeoCode(WHSL);
                // replace this row by a new row that's incremented by three new columns
                var row = rows[i];
                var oldArray = row.Items;
                var newArray = new String[oldArray.length + 3];
                oldArray.CopyTo(newArray, 0);
                newArray[newArray.length-3] = codes.GEOX;
                newArray[newArray.length-2] = codes.GEOY;
                newArray[newArray.length-1] = codes.GEOZ;
                row.Items = newArray;
                rows.RemoveAt(i);
                rows.Insert(i, row);
            }
        }

        /*
            Returns the Geo codes XYZ for the specified WHSL.
        */
        function GetGeoCode(WHSL: String) {
            var i = 0;
            while (i < this.GeoCodes.Count && this.GeoCodes[i]['WHSL'] != WHSL) i++; // search array
            if (i < this.GeoCodes.Count) return { 'GEOX': this.GeoCodes[i]['GEOX'], 'GEOY': this.GeoCodes[i]['GEOY'], 'GEOZ': this.GeoCodes[i]['GEOZ'] }; // found WHSL
            else return { 'GEOX': '', 'GEOY': '', 'GEOZ': '' }; // no hit
        }

        function OnRequestCompleted(sender: Object, e: RequestEventArgs) {
            try {
                var controller: MForms.InstanceController = sender;
                if (controller.RenderEngine == null) {
                    // program is closing, cleanup
                    scrollViewer.remove_ScrollChanged(OnScrollChanged);
                    controller.remove_RequestCompleted(OnRequestCompleted);
                }
            } catch (ex: Exception) {
                debug.WriteLine(ex);
            }
        }

    }
}
Result
This is the final result:

Future work
This solution loads all records from the API call with MaxReturnedRecords=0. This could be a problem when there are more than several hundred records, or when the server/network response time is bad. I yet have to find a solution to improve this.
Also, the user could scroll the page while the response of the API call hasn’t arrived yet. I yet have to improve the code for that.
Finally, in my next article I will illustrate how to achieve the same result without programming, by using Custom Lists and Mashups.
UPDATE 2012-09-27
I updated the script to detach the event handlers on program close, i.e. cleanup.
Related articles:
- Custom Lists & Mashups, how to add columns to a list with a Custom List and Mashups
- How to add a column to a list, older post on how to add columns to a list with a script
- How to add a column to a list — #Comments
- Adding a new column in a M3 List, by Karin
- BackgroundWorkers in Smart Office Scripts – Part 2 – How to disable/enable the user interface, how to indicate activity, and how to show progress
- Geocoding of Stock Locations in MMS010
