I found a quick workaround to have Google Maps back into Infor Smart Office Mashups. There are currently three problems with Google Maps in Mashups. I’m using Smart Office 10.1.1.1.5, on Windows 7 Professional 64 bits, with Internet Explorer 11.0.9600.17207.
Problem 1
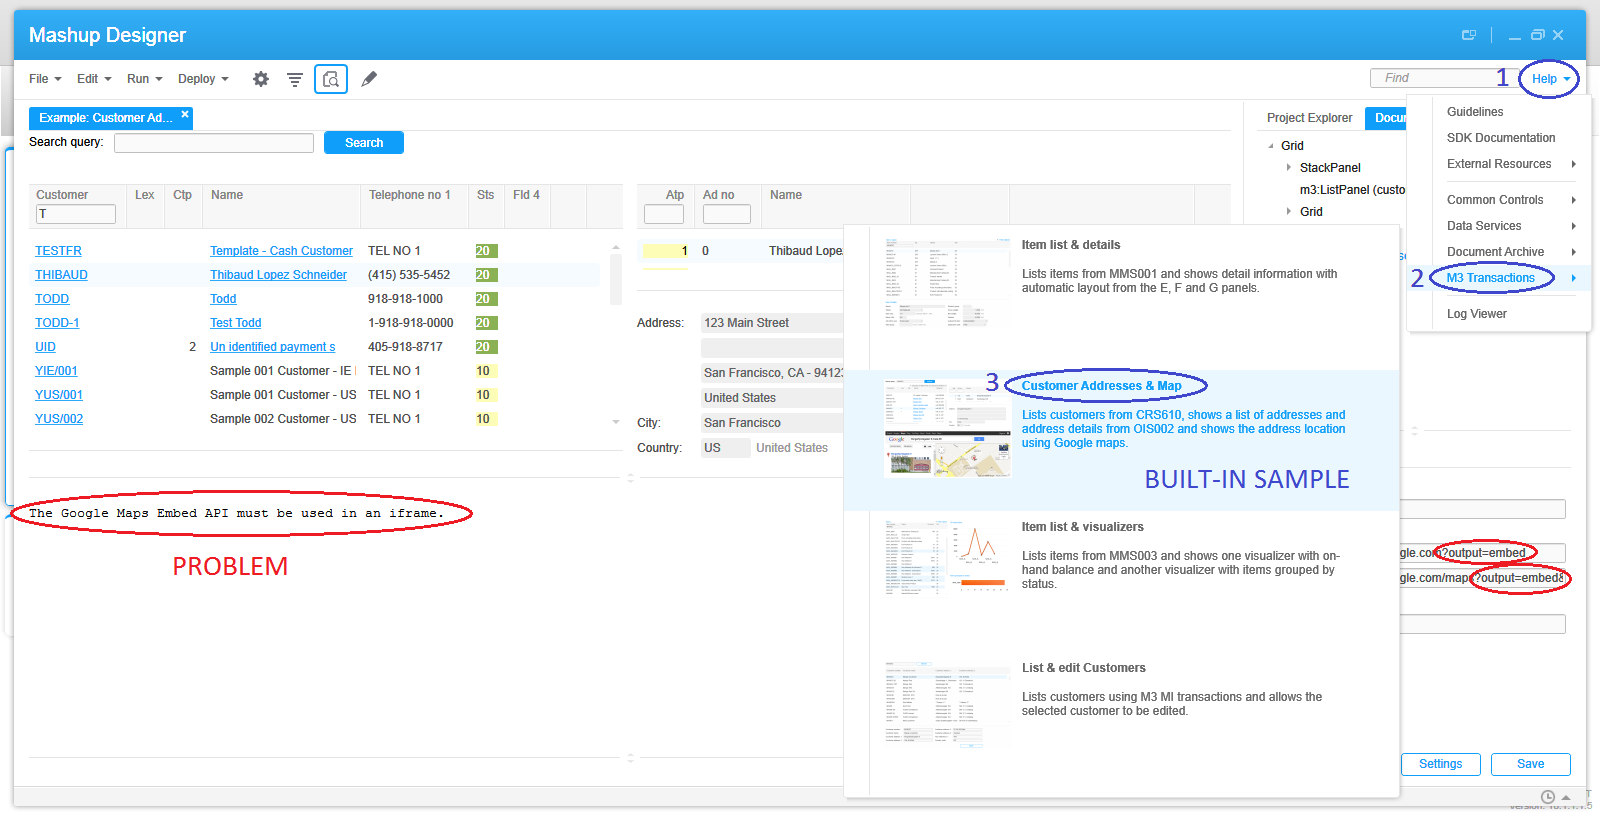
The first problem is that some time ago Google Maps changed their service and removed the parameter output=embed from the allowed parameters of the URL. The embed output was great as it used to hide the header, footer, and sidebar making it ideal for limited spaces like Mashups; the default output having been classic. With that parameter now disallowed, it causes Google Maps to display the error “The Google Maps Embed API must be used in an iframe” and that happens whether in a browser or in a Mashup, and it even broke the built-in Mashup sample of Mashup Designer:
I haven’t investigated all the details of the problem but I found a workaround. Replace the value embed of the parameter with either of these values: svembed, embedmfe, or svembedmfe. sv seems to be the prefix for Street View. I haven’t yet figured out what the suffix mfe means nor if it will remain long lived.
Here’s a sample result of Google Maps embedded in my browser:
Problem 2
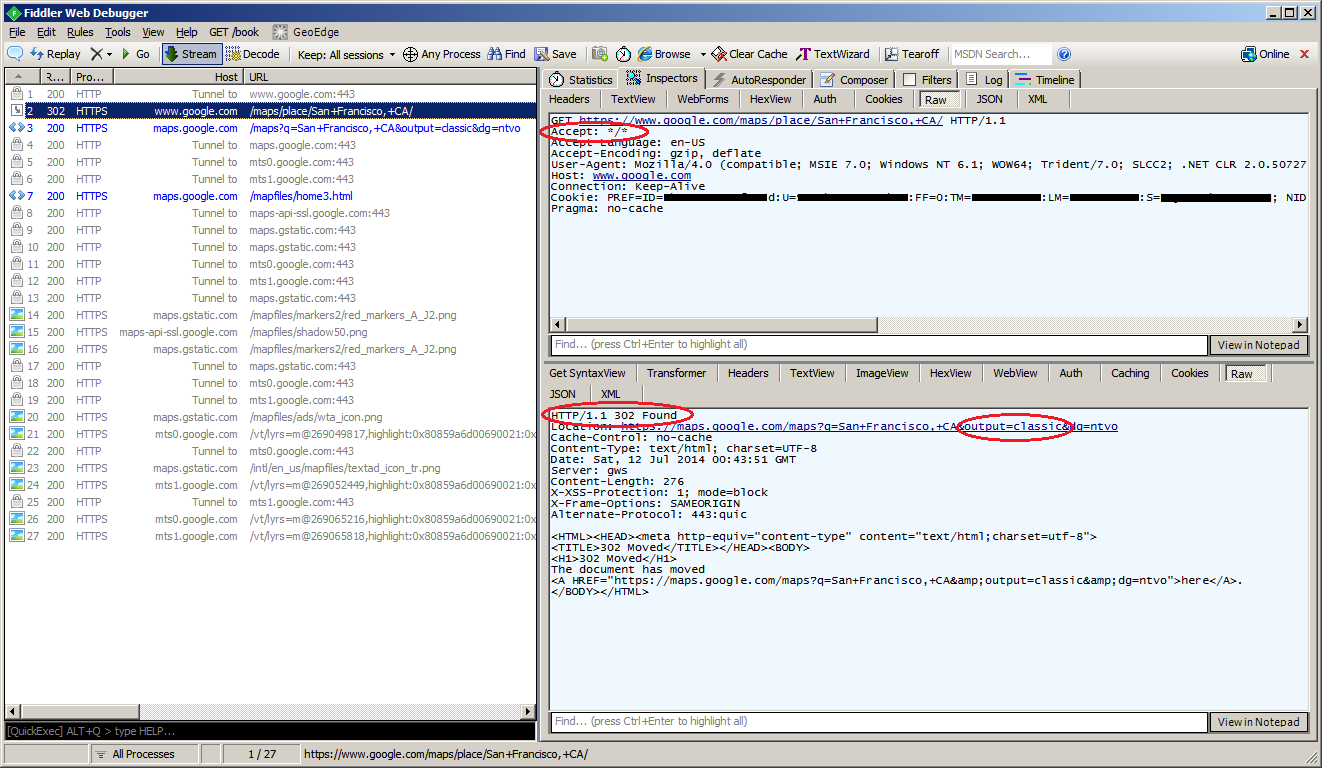
Instead of using the output parameter we could simply use the Google Maps new look which is lean and sexy and also hides the header, footer and sidebar. But unfortunately, the WebBrowser control of Smart Office Mashups sends the HTTP request header Accept: */* instead of Accept: text/html, application/xhtml+xml, */* and that causes Google Maps to respond with HTTP 302 Found redirecting to output=classic and we’re back at problem 1:
Problem 3
The third problem is that Google Maps in a Mashup now throws a JavaScript error popup:
I haven’t yet investigated what causes it. It seems to be caused by the old render mode IE7 that Smart Office uses (although in the past the same render mode wasn’t causing the script error). The workaround is to add a registry key to your Windows to force the render mode to IE11 (and you need to install Internet Explorer 11). You can read more about this in Karin’s post. Microsoft has tools to push registry keys to users computers. Here’s the Windows Registry key I just added on my computer:
Result
After changing to output=svembed, and after adding the Windows Registry key, here’s the result in my Smart Office: the output is correctly embedded, there is no script error, the map works correctly (zoom/pan/etc.), and the Mashup events still work correctly:
That was a quick workaround to get Google Maps back into Mashups. If you know of a simpler solution let me know.
Once in a while I receive this question of how to call an M3 Web Service (MWS) with SQL adapter in a Mashup for Infor Smart Office. As a reminder, MWS has three adapters: M3 API, M3 Display Program (MDP), and SQL (JDBC). Each will return a different SOAP response, thus each will need a slightly specific XAML. The trick with the SQL response is the new0Collection.
Here is my sample SQL:
SELECT OKCUNO, OKCUNM
FROM MVXJDTA.OCUSMA
WHERE OKCONO=? AND OKSTAT=?
Here is the web service in MWS Designer (note the new0 result set in the output):
Here is the Web service test tool in Smart Office (note the new0Collection):
Here is the resulting Mashup:
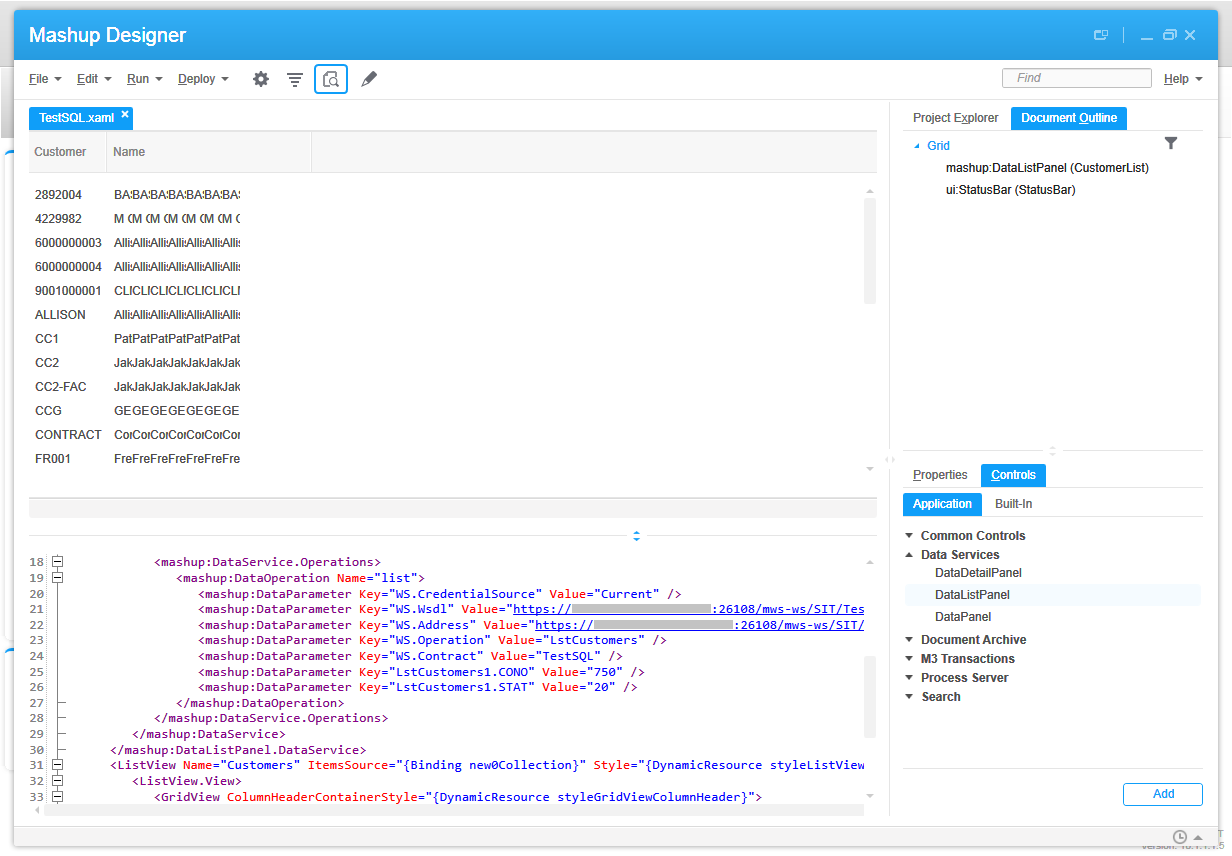
And here is the final XAML source code with the new0Collection binding highlighted:
The script TestEniroGeocode.js uses the Eniro geocode API. This API seems to be best for address validation, and you don’t need an account for it. But it seems to be deprecated, and I was only able to find an old copy of the documentation.
Eniro API
The script TestEniroAPI.js uses the Eniro API. This API seems to be for searching places only, like “restaurants in Stockholm”, and doesn’t seem usable for address validation for M3. Also, you will need an account with Eniro, and you will need to sign in to api.eniro.com to see your account profile, key, and documentation.
Those were two quick proof-of-concepts scripts for Infor Smart Office to illustrate how to use Eniro to do address validation for Infor M3.
That’s it! Please comment, like, share, follow, author, contribute to the project, donate your source code. Thank you.
Today I will illustrate how to get an item image from Infor Document Archive.
For that, I will use Document Archive Client to add an item image with the item number (ITNO) as an attribute, and I will retrieve the item image using the Document Archive REST API. I will do the illustration with two servers on different version numbers, one server running Document Archive version 10.0.2.4.28 and the other server running version 10.1.0.0.93.
I will later use these steps for my Google Glass project to display in Glass the item image of each picking line.
Document Archive Client in Smart Office
If you have Document Archive installed in your Grid, you will find the Document Archive Client in the Smart Office Navigator widget:
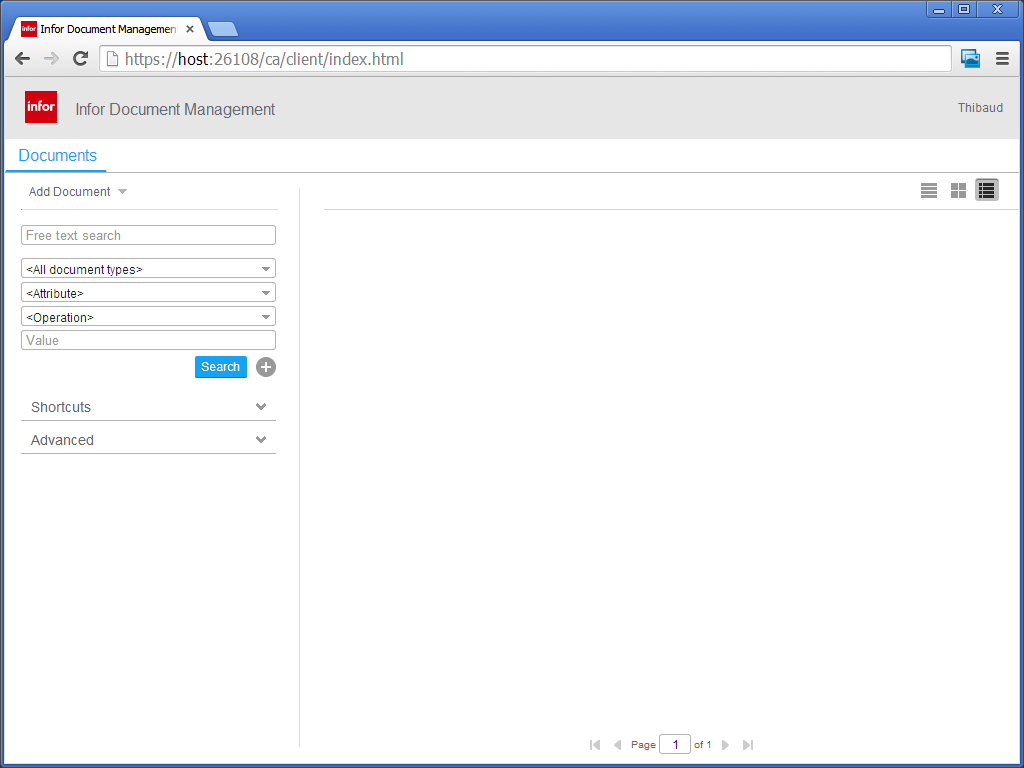
Document Archive web interface
Document Archive has a web interface at /ca/index.html.
Document Archive 10.0.x will simply return the version number:
Document Archive 10.1.x has a much richer web interface with a web client, an admin client, a mobile client, a Ming.le part, management pages, and an API overview:
The path /ca/impl/connection/information will return the API version number:
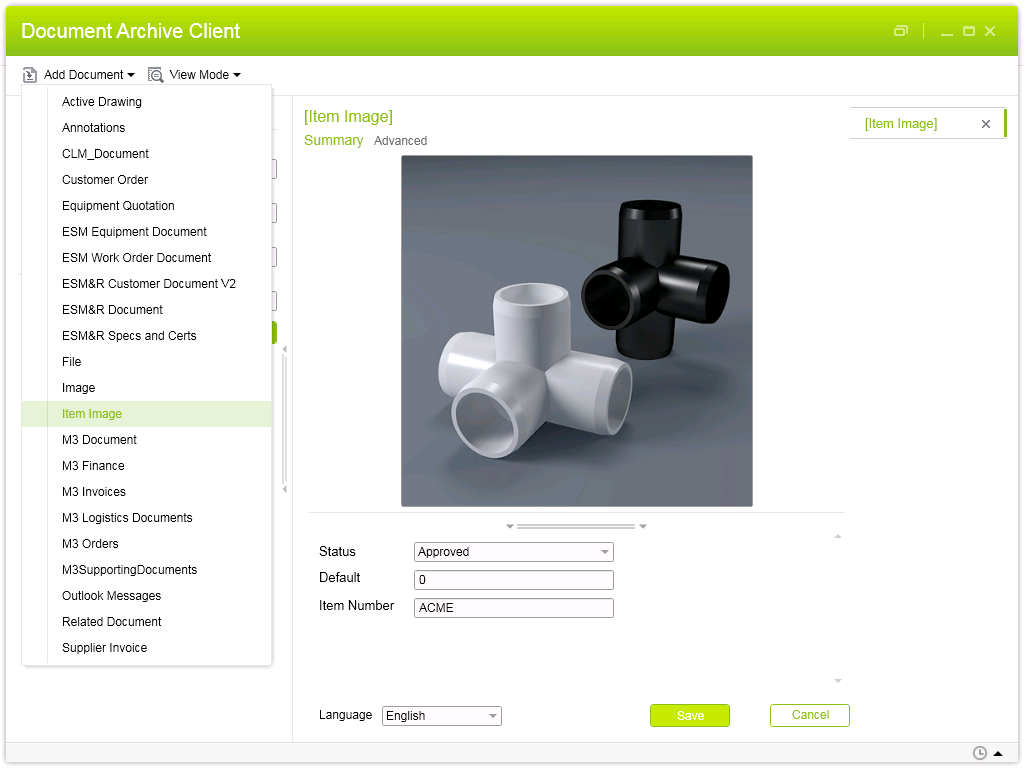
How to add an item image
To add an item image to Document Archive:
Select Add Document > Item Image
Drop an image file
Set Status to Approved
Enter an Item Number (ITNO)
Click Save
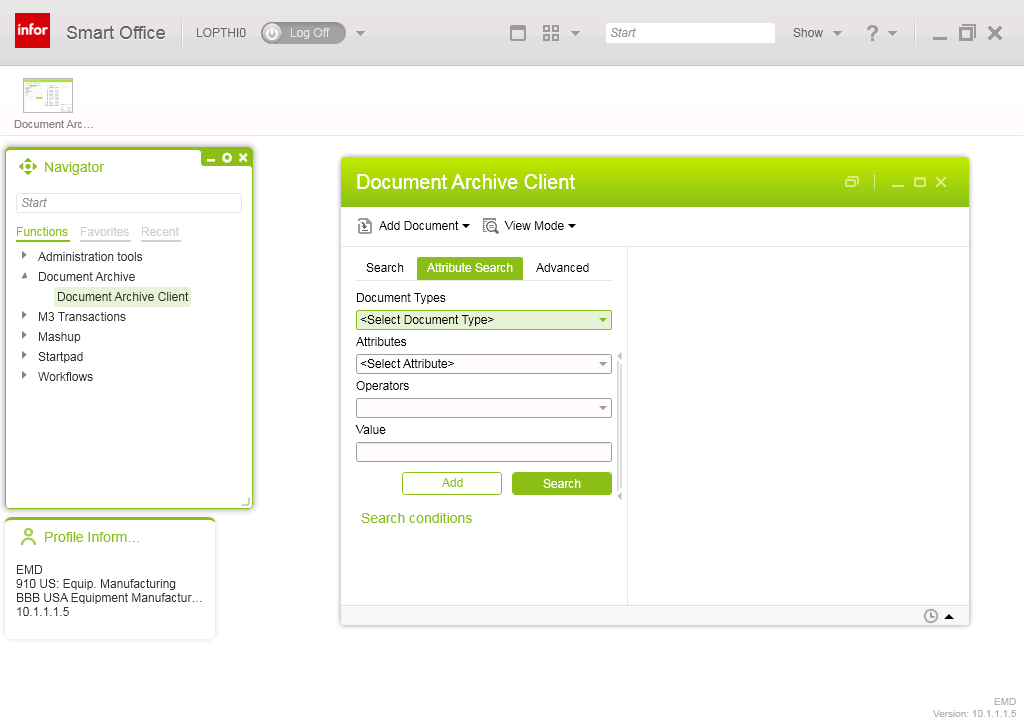
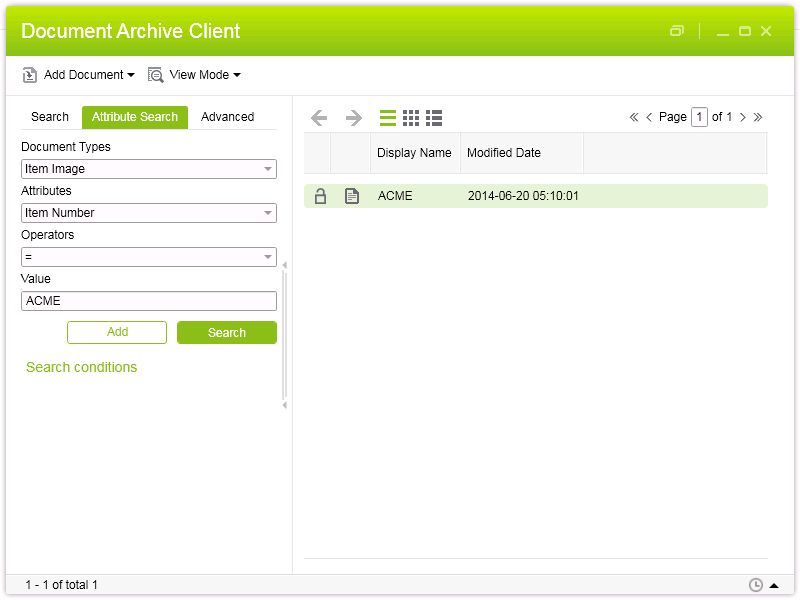
How to search for an item image
To search for an Item Image by item number (ITNO):
Select Attribute Search
Set Document Type to Item Image
Set Attribute to Item Number
Set Operator to =
Enter the item number in Value
Click Search
Document Archive Client will return a list of possible matches, and for each match it will return the image converted into different sizes like original, preview, and thumbnail.
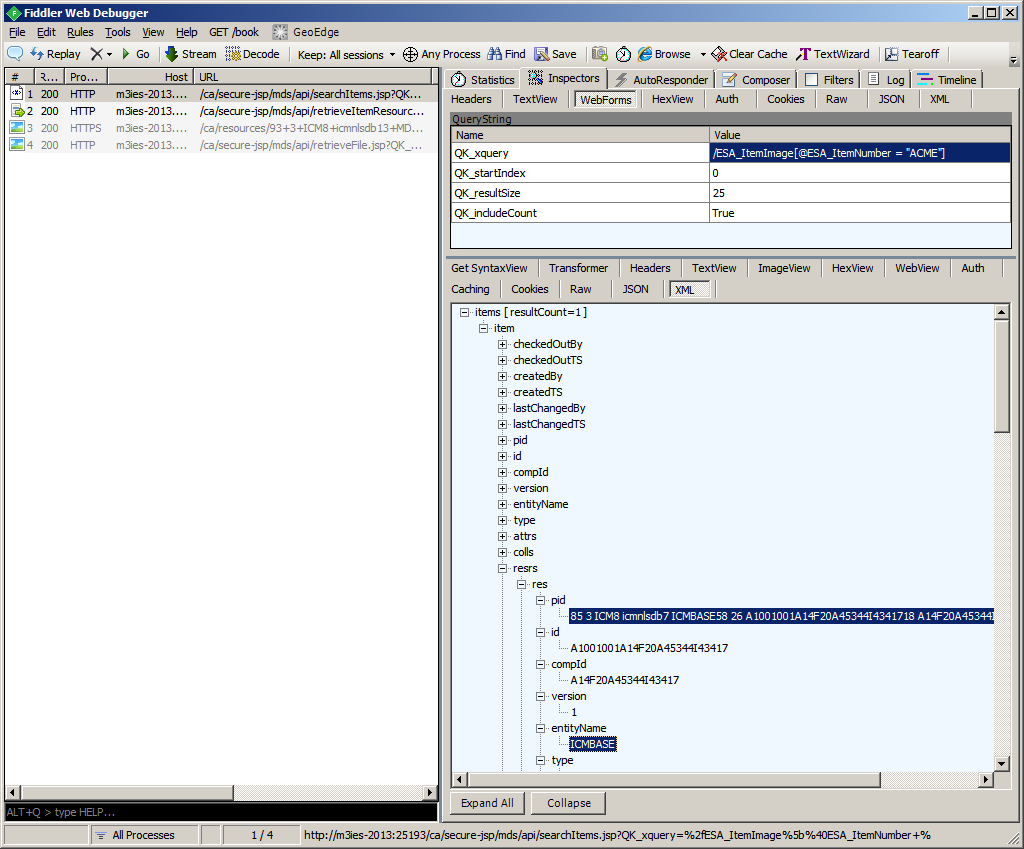
HTTP Requests and query
When I intercept those steps in Fiddler, I see four HTTP Requests, starting with the query:
The server with Document Archive 10.0.x used the query /ESA_ItemImage[@ESA_ItemNumber = “ACME”], and the other server with Document Archive 10.1.x used the query /M3_ITEM_IMAGE[@M3_ITNO = “ACME”]. I’m not fully familiar with how Document Archive is configured, so I don’t know if the query is based on the version number or if somebody did a manual configuration. So check what the query is on your server.
From the query, the server returns a list of matches, and for each match it gives the PID of the document and a list of resources with URLs to the item image in various sizes: original, preview, and thumbnail.
I’m only interested in the original item image, that’s entityName=ICMBASE. The PID would be given by the following XPath on the API response:
//res[entityName='ICMBASE']/pid/text()
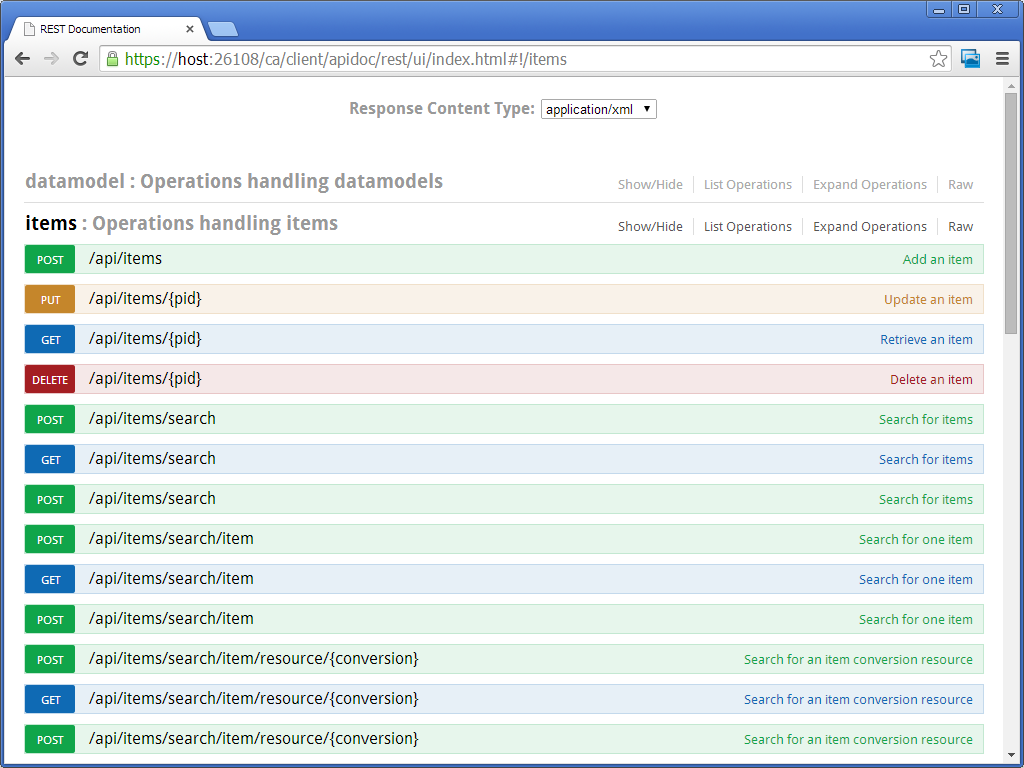
Document Archive REST API
Document Archive has a REST API that we can access from http://host:port/ca .
By trial and error, I determined I could get the item image in only one request with the following API, the parameter $query properly URL-encoded, and HTTP Basic Authentication:
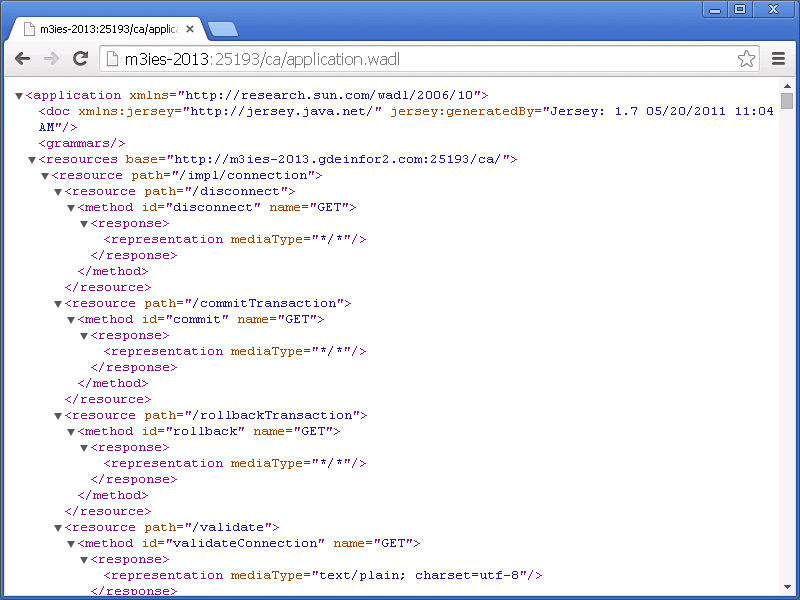
It wasn’t easy. I ran into a lot of errors which I still don’t understand and which I didn’t fully document. Here are a few bits and pieces I noted:
Unfortunately, the WADL doesn’t mention the input parameter QK_xquery for the searchItems.jsp API, therefore there may be more undocumented API that also accept QK_xquery as an input parameter; to be tested.
In some of my tests the server threw HTTP 401 Unauthorized which led me to believe the user/password was wrong. It turns out the Grid session provider didn’t allow HTTP and only allowed HTTPS. Very misleading error message.
I got a lot of cryptic prolog errors: “Parsing error: Invalid input data: Content is not allowed in prolog. org.xml.sax.SAXParseException”. It seems to be a bug in Document Archive for POST methods and the workaround is to manually change the HTTP Request header to Content-Type: text/plain.
I got a lot of inexplicable java.lang.NullPointerException even with the correct input parameters.
I got a lot of inexplicable HTTP/1.1 500 Internal Server Error even with the correct input parameters.
That was quick overview of how to add an item image by item number (ITNO) in Document Archive, and how to retrieve it with the REST API.
Here is a Hello World illustration of Augmented Reality (AR) for Infor M3 using Metaio Creator and the Junaio Browser on my iPad. The demo shows a 3D warehouse with aisles, racks, and levels, where I highlighted one of the boxes in red. This new result complements my previous demo of AR for M3 which was implemented programmatically in JavaScript. This time I am using Metaio Creator.
Why it matters
The idea is to highlight the stock location of the the next item to pick in a picking list so the picker can quickly identify where to go in the warehouse. This scenario is specially useful for temporary workers that are hired for campaigns on short notice and are not yet familiar with the warehouse thus saving costs in training and picking time.
Also, Augmented Reality is predicted to be one of the next multi-billion dollar industries in five years from now, so this is one of the learning steps I am taking in that direction.
Preview the demo
To preview the demo on your device (PC, Mac, iPad, Android) follow these instructions:
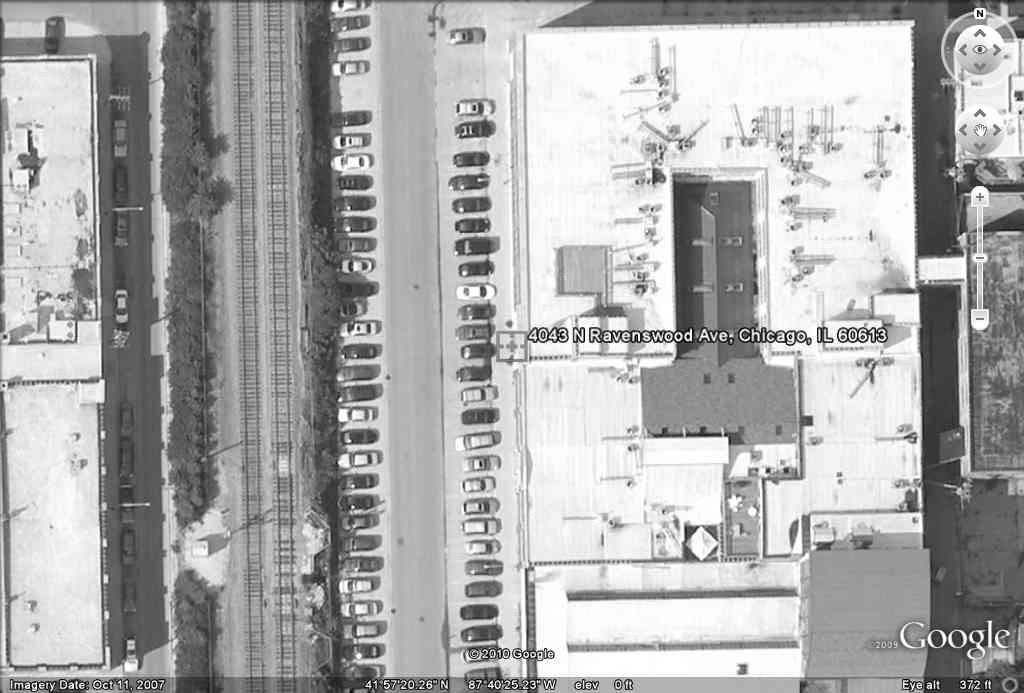
Print the following satellite picture in full page or bigger, and place it on a flat surface; that will be the trackable AR marker:
Install the Junaio Augmented Reality Browser app on your device (from junaio.com for PC/Mac, from the App Store for iPad, or from the Google Play Store for Android).
Open the app and click Scan.
Scan the following QR code; Junaio Browser will identify the QR code, and will download the resources from my channel ThibaudWarehouse3D:
Point your device’s camera towards the printed satellite picture. Junaio Browser will track the satellite picture and will register the warehouse 3D accordingly. Here is a screenshot of the result:
How I built it
The creation process is simple.
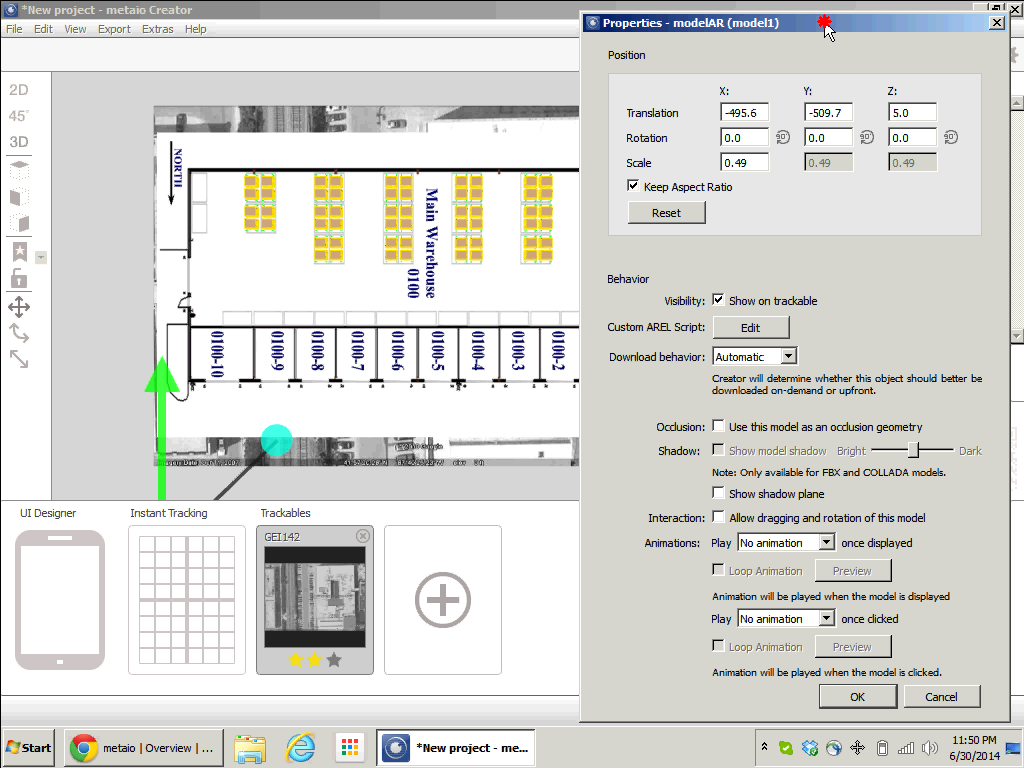
I used my previous 3D model of a warehouse with racks, aisles, levels, and boxes that I had created in SketchUp for a demo three years ago. I removed the walls and roof. I removed unnecessary 3D elements that slow down the 3D rendering pipeline on iPad. And I hard-coded an arbitrary box in red.
Here is a screenshot of the trackable and 3D model in Metaio Creator:
Here is a screenshot of the channel creation:
Here is a video of the entire creation process and preview:
Summary
That was how to create a simple Hello World demo of Augmented Reality for M3 using a 3D warehouse and Metaio Creator to highlight the stock location of the next item to pick in a picking list to save training time and picking time.
Future version
In a future version, I will un-hard-code the red box, and I will highlight it programmatically using Metaio SDK.
Today I’ll illustrate two usability ideas for Infor M3 – content-aware re-sizing of M3 programs, and text interpolation – to make M3 more usable on high resolution screens.
Synopsis
The M3 user interface was built over 20 years ago for AS/400 and 5250 screens of 73 up to 98 columns and 23 rows, that’s about 0.0022 Mega-characters. The M3 user interface has evolved over the years and has stabilized in Smart Office around the same number of columns and rows as 20 years ago with each cell measuring 10 x 22 pixels at 100% zoom level, that’s about 0.5 Megapixels. It’s about the same for Infor H5 Client.
Meanwhile, screen resolutions and pixel density have continued to increase at an incredible pace. Mobile phones are being produced in China with a horizontal resolution of 3,000 pixels (3K). Televisions are being produced in Japan with a horizontal resolution of 8,000 pixels (8K). And the trend will continue. I even started working on a laptop that has a 3K screen, 3200 x 1800, that’s 5.8 Megapixels or a seven-fold increase in available pixels compared to 1024 x 768. The number of pixels on the surface grows to the square of the linear resolution, for example if we multiply by two the screen resolution on each axis from 1600 x 900 to 3200 x 1800 that’s a four-fold increase in surface.
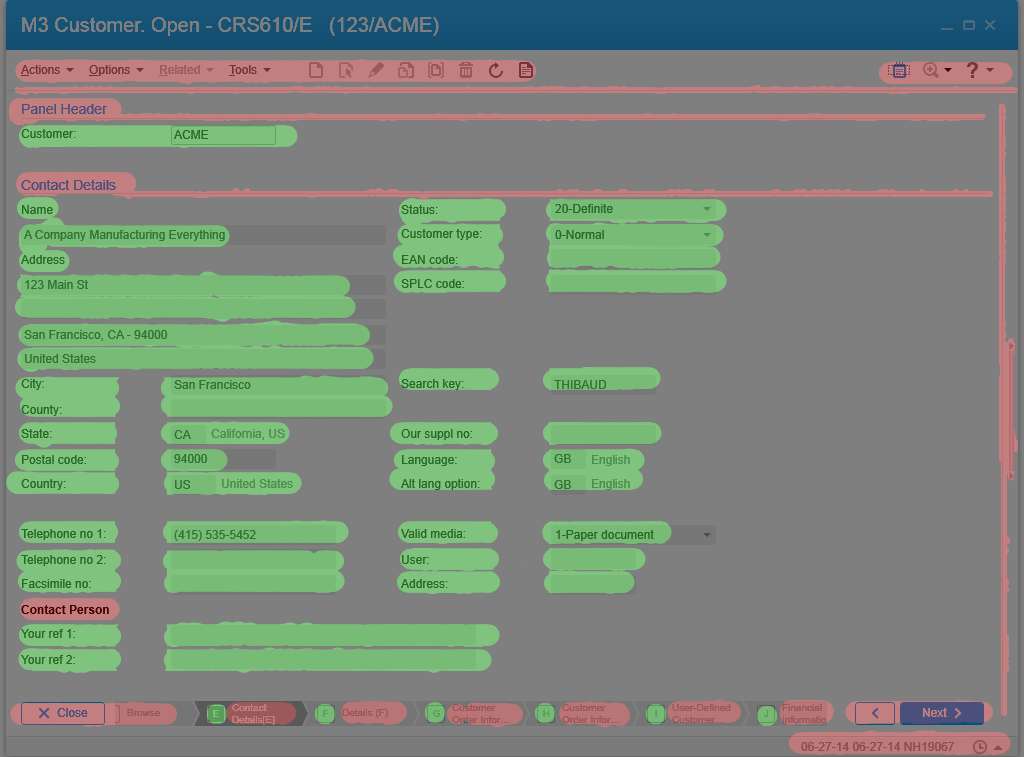
Despite those technological advances, the M3 user interface hasn’t adapted. Here is a screenshot of Smart Office on my laptop with a screen resolution of 3200 x 1800 pixels, showing CRS610/E sized to 1024 x 768 pixels at the top left corner; the result evidently illustrates how the majority of the space is unused:
There are numerous technical challenges to increasing the number of rows and columns of M3 programs, leading to problems in the database and in legacy source code, but there are several steps we can take in that direction.
Two years ago I illustrated the usability idea how to tile windows in Smart Office. Today, I will illustrate two new ideas: content-aware re-sizing of M3 programs, and text interpolation.
Content-aware re-sizing of M3 programs
The first usability idea is to implement content-aware re-sizing of M3 programs with inspiration from seam carving as introduced by Shai Avidan and Ariel Shamir in 2007. You can watch a demonstration of seam carving in the authors video here. The idea of seam carving is to calculate the energy function of neighboring pixels and remove paths of lowest energy in a way that respects the overall composition of the image. We can manipulate the energy values to keep certain pixels and discard others.
To try seam carving, you can use the Content Aware Scaling feature in Adobe Photoshop, or the Liquid Rescale plugin for Gimp, or the online tool RSIZR.
Here is an example of CRS610/E in RSIZR; I used the preserve and remove brushes to mark in green the important portions of CRS610/E to keep and in red the portions to discard:
Previous known techniques to re-size windows include re-scaling but it causes cropping and scrollbar hell, and re-sizing but it causes the image to be squooshed and minimized. The ideal solution is re-targeting with content-aware re-sizing.
Here is a video of the result using a screenshot of CRS610/E in RSIZR:
It’s not possible to simply implement seam carving to M3 because the rendering of the M3 user interface is based on text and not on pixels. Yet, we can approximate an implementation by choosing which parts of the user interface we want to keep and which parts we can discard. We can do this with a hierarchy of importance. And we can do this programmatically. The new M3 user interface does something similar with the adaptable panel sequence ribbon.
Text interpolation
The second usability idea is text interpolation in M3 programs for text like column headers and labels.
The language constants are chosen in different widths to fit the varying space of the target medium. The size ids are: 03, 05, 10, 15, AA, C0, C1, C2, CA, and CF.
The text is retrieved at run-time based on the user’s language settings in MNS150.
The Java source code of each M3 program maps the fields and message identifiers. For example CRS610DSP.java:
For example, here are the identifiers of some common fields in CRS610:
Customer name – CUNM: WNA01
Customer number – CUNO: WCU02
Telephone number 1 – PHNO: WPH01
We can get the values in a Smart Office script with:
function ... {
    var list: ArrayList = new ArrayList();
    list.Add(new TranslationItem(messageId + width, "MVXCON"));
    TranslationService.Current.Translate(list, OnTranslation, "GB");
}
function OnTranslation(items: IEnumerable) {
    for (var item: TranslationItem in items) {
        if (!String.IsNullOrEmpty(item.Text)) {
            if (item.Text != item.Key) {
                debug.WriteLine('Translated ' + item.Key + ' to ' + item.Text);
            } else {
                debug.WriteLine('Key ' + item.Key + ' not found in file ' + item.File);
            }
        } else {
            debug.WriteLine('item.Text is null or empty');
        }
    }
}
That calls the Net Extension command TRANSLATE.
The result would be for example:
PHNO[WPH0103]=Tl1
PHNO[WPH0105]=Tel 1
PHNO[WPH0110]=Tel no 1
PHNO[WPH0115]=Telephone no 1
PHNO[WPH01AA]=telephone number 1
We can then interpolate the resulting Strings, for example my simple algorithm returns:
Tl1
Tel1
Tel 1
Tel n1
Tel nb1
Tel nb 1
Tele nb 1
Telep nb 1
Teleph nb 1
Telepho nb 1
Telephon nb 1
Telephone nb 1
Telephone nub 1
Telephone numb 1
Telephone numbe 1
Telephone number 1
Here’s the simple algorithm I used for that:
/*
    Returns the specified headers interpolated one character at a time, first ocurrence of any different character, from left-to-right.
*/
function interpolate(headers) {
    var interpolated = new ArrayList();
    var str1;
    var str2;
    for (var i = 0; i < headers.length - 1; i++) {
        str1 = headers[i];
        str2 = headers[i + 1];
        interpolated.Add(str1);
        for (var j = 0; j < (str2.length - 1) && str1 != str2; j++) {
            if (j < str1.length) {
                if (str1[j] != str2[j]) {
                    // the character at this position of str2 doesn't exist in str1, add it to str1
                    str1 = str1.Insert(j, str2[j]);
                    interpolated.Add(str1);
                }
            } else {
                // we reached the tail of str1, add the tail of str2 to str1
                str1 = str1.Insert(j, str2[j]);
                interpolated.Add(str1);
            }
        }
    }
    interpolated.Add(str2);
    return interpolated;
}
It turns out the algorithm is not that simple to implement as not all the language constants in M3 can be automatically interpolated, for example the abbreviation no (letter O) would have to be specially interpolated to number (no letter O).
Here is a resulting video of column header interpolation in CRS610/B; I manually sanitized the interpolated Strings and added the field name in parenthesis:
Summary
In this post I illustrated two usability ideas – content-aware re-sizing of M3 programs, and text interpolation – to benefit from the technological advances in ever higher resolution screens and to improve the M3 user interface. This would be specially ideal for large Mashups.
That’s it! If you liked this post, please click the Follow button to subscribe to this blog, leave your comments in the section below, click Like, and share with your peers.
At the Pre-I/O Glass Hackaton in San Francisco last week-end we built an app for Google Glass for Khan Academy. It may well be the first of its kind. This first alpha version for teachers displays a notification on Glass when students are struggling during an exercise. We published it on GitHub at GlassKhan.
About Khan Academy
Khan Academy flipped education inside out. When I was in school, we would passively seat in class and listen to teachers give lectures for an hour, and then they would give us homework to do on our own at home. Khan Academy flipped that system inside out. They tell students to watch the lectures on the Internet at their own pace, where they can pause, accelerate, or deepen a section of interest. And they tell students to do the homework in class in groups with the teacher. That creates more engagement from the students as students are familiar with the technologies, and students can help each other in class between peers with the teacher present to answer questions. And as students are doing the exercises on Khan Academy’s website, teachers have hundreds of data points about students to tell who is behind, who is ahead, on what topics, and more. So we set out to build a Glass app for Khan Academy.
The hackaton
The hackaton was a 24h coding competition with education as the main theme, to “see leaps forward in Education using technologies like Google Glass”. I teamed up with Ross Gruetzemacher and Ryan McCormick. We brainstormed several ideas including an app for Khan Academy.
The first premise was that we would build an app with the teacher in mind since it’s currently easier to justify the cost of one Glass per teacher rather than one Glass per student. In the future the cost of Glass will probably be lower but that future hasn’t happened yet.
The second premise was that such app mustn’t already exist. We quickly confirmed that on the Glassware page. We also did a Google Search for the terms “Google Glass” and “Khan Academy” and we found two relevant hits. The first hit from Forbes, Google Ventures Launches Glass Collective With Andreessen, Kleiner Perkins, To Fund Google Glass Startups, said “Doerr is excited about Glass applications for education as well as health care. He cited companies like Udacity and Coursera and Khan Academy that are working on education but sees Glass as adding a whole new layer to education.” The second hit from Kurzweil Accelerating Intelligence, Will anyone create a killer app for Google Glass? said “Khan Academy software engineer Stephanie Chang, who was at the Foundry events, has ideas such as creating a Glass app for teachers, who could be notified as they give a lecture which students are struggling.” Both articles validated our idea. There’s funding available, and there’s a demand for an app.
Development
Teachers have a dashboard on Khan Academy’s website that shows the roster of students, classes, progress reports, and hundreds of data points.
Here is a screenshot of the coach dashboard:
And Khan Academy has an API that gives access to data about what student is doing what exercise when and at what level. The data is private to the coach and to students that have accepted a teacher as a coach. And the data is protected with OAuth.
Here is a screenshot of the API Explorer:
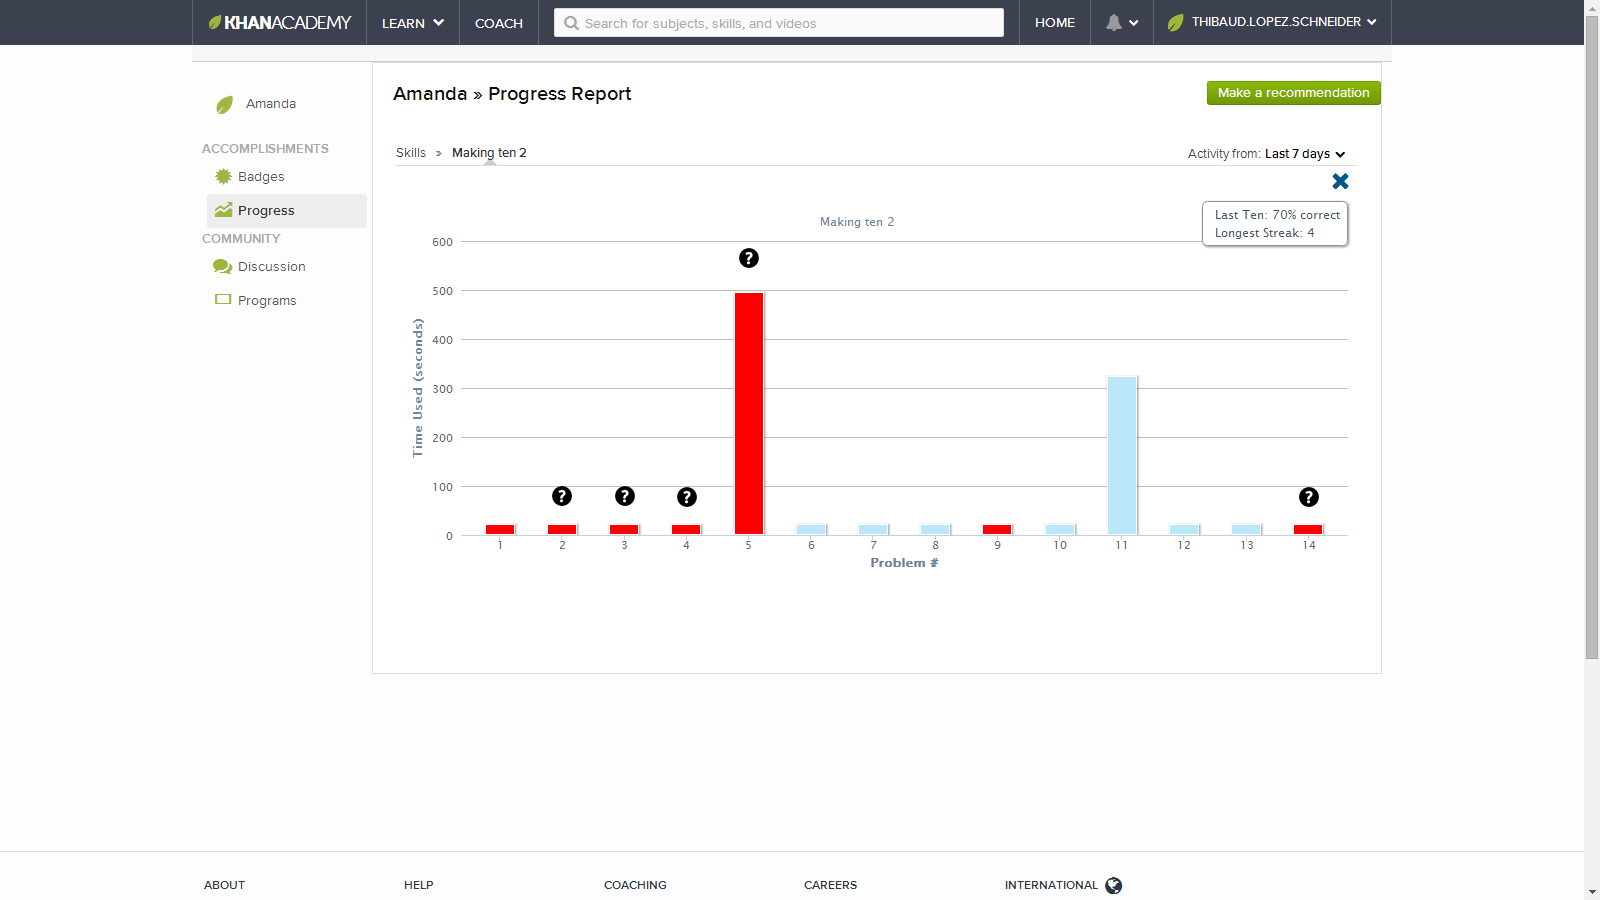
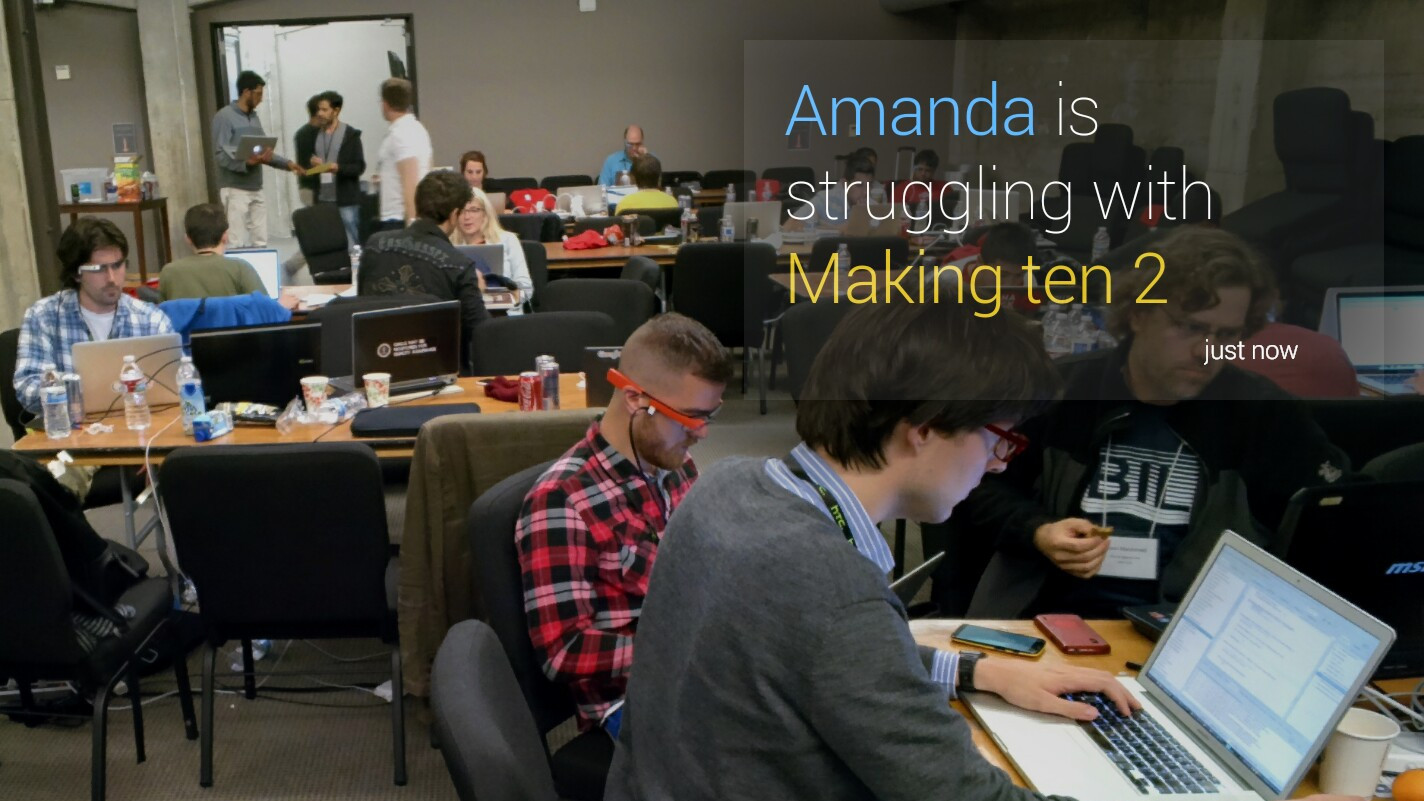
As soon as a student is struggling with an exercise the API knows about it. The criteria to be considered struggling on a exercise is based on metrics like time spent on the exercise and number of hints used. We setup dummy teacher accounts and dummy student accounts, and we purposely failed at plenty of elementary math exercises to trigger the flag struggling = true . For that we query the API /api/v1/user/exercises/<exercise_name> . When that event happens, we send a timeline card to the teacher’s Glass with the nickname of the student, the level “struggling”, the name of the exercise, and the time “just now”. That’s four pieces of data.
It’s a useful micro-interaction for the teacher and it follows the principle about the now as explained by Google Developer Expert Allen Firstenberg:
From a technical point of view, we used the Google Mirror API and the Java Quick Start. We built a decorator and an adapter in Java for the Khan Academy API. And we built a loop for each student, for each exercise, test if struggling == true.
Results
Here are two screenshots of the result, we randomized the pairs of colors for the nickname and exercise name so teachers get distinct visual cues:
Benefits
This app will help students who are shy and don’t want to raise their hand and admit they don’t know when their friends are watching. With the notification the teacher can go help the student without the student having to feel embarrassed to ask for help.
Also, this will help teachers not be distracted by the iPad or the computer.
And teachers that have an inclination for programming can take the source code and advance it for their own creative ideas.
Caveats
This first alpha version of the app contains shameful hard-coded OAuth to Khan Academy that we need to completely re-code. We also lack a notification system; we simply implemented a one iteration loop that pulls from Khan Academy’s website. And there are rough edges to smooth.
Future
Future versions of the app could show other types of events such as levels of success rather than levels of struggle.
We’d like to see this app survive beyond the hackaton. If you’re a developer and would like to contribute, please contact us. And if you work at Khan Academy, please contact us, we need new APIs from you (coach data, notifications, and the servers returned HTTP 500 “Internal Server Error […] the server is overloaded”).
That’s it! Please like, comment, and spread the goodness to your teachers and students.
“University of Bremen student Hannes Baumann demonstrates using a wearable computer for order picking. 750,000 warehouses worldwide distribute approximately $1 US trillion in goods, and order picking accounts for about 60% of the total operational costs of a warehouse. Using a head-up display to guide order picking virtually eliminates errors and is significantly faster than paper or audio based methods. HUD-based order picking is also less expensive and more flexible than many other automated picking techniques. Hannes’s thesis work was supported by the SiWear project and advised by Professor Thad Starner and Professor Michael Lawo.” — Thad Starner, Published on Sep 7, 2012
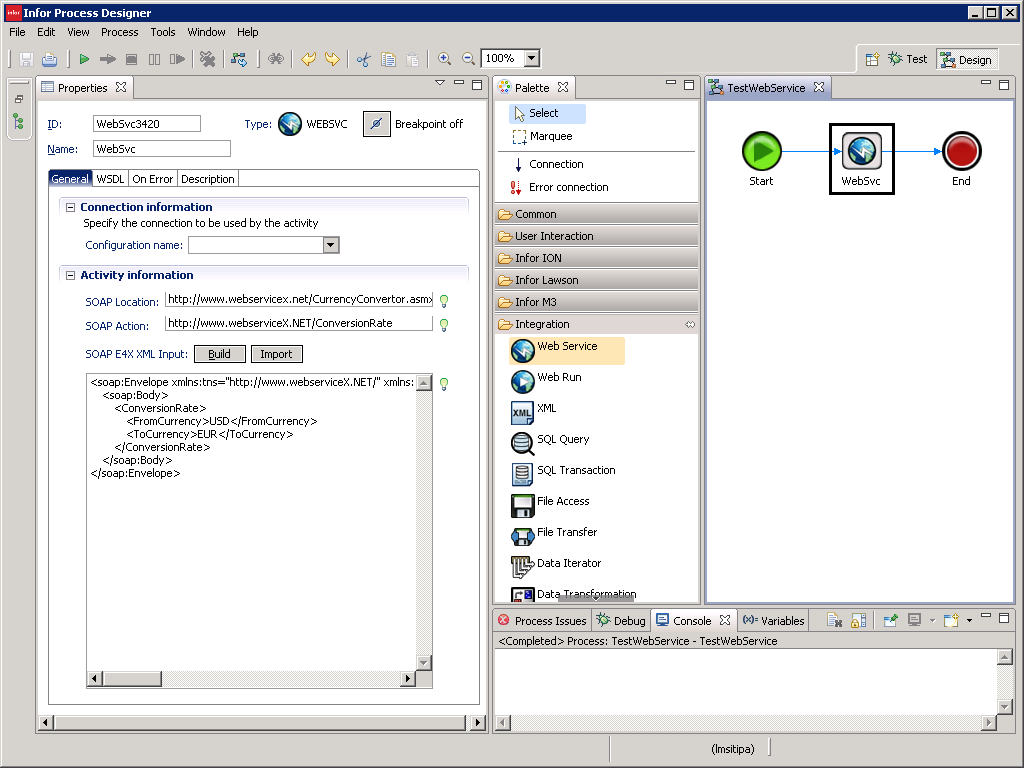
Infor Process Automation (IPA) communicates with other servers over the network – using for example the WebRun, Web Service, SQL Query, and Email activity nodes – but it lacks the ability to dump the network traffic for troubleshooting purposes. Here are my solutions.
Background
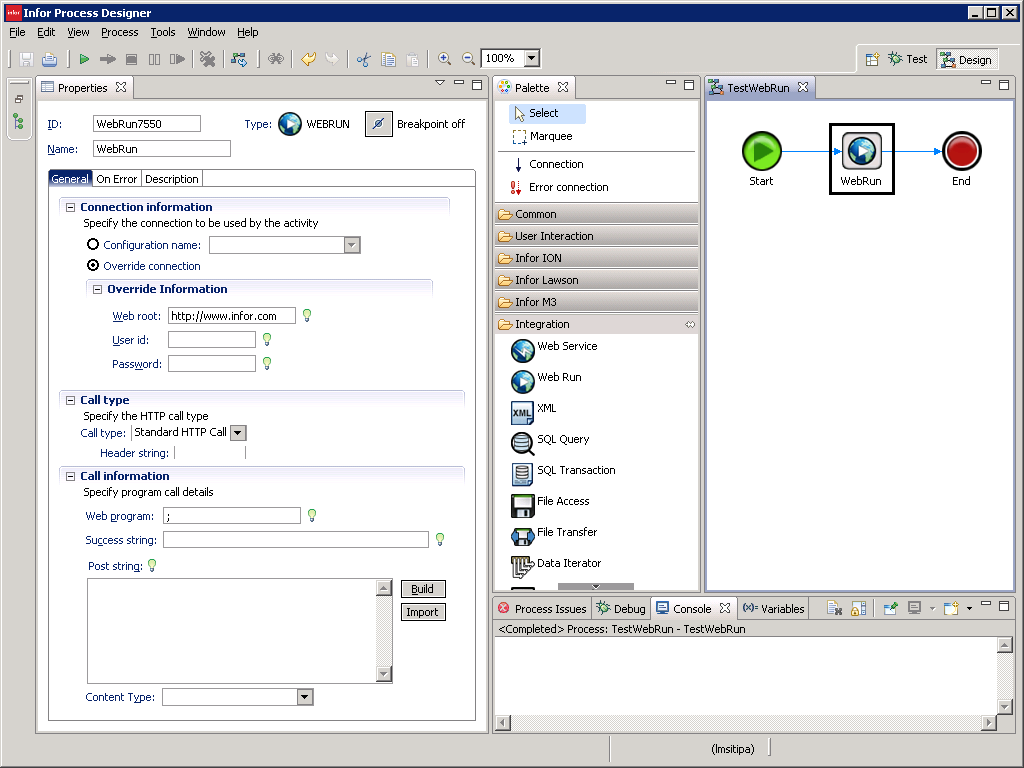
The WebRun activity node uses HTTP:
HTTP request header
HTTP request body
HTTP response header
HTTP response body
The Web Service activity node uses SOAP over HTTP:
HTTP request header
HTTP request body
SOAP request header
SOAP request body
HTTP response header
HTTP response body
SOAP response header
SOAP response body
The SQL Query activity node uses JDBC.
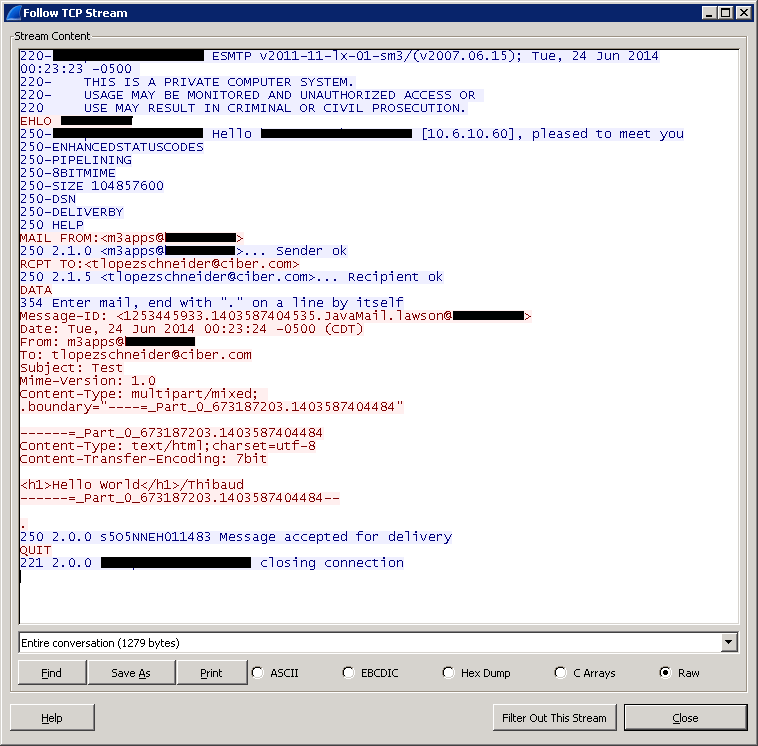
The Email activity node uses SMTP.
And IPA has other activity nodes for products such as Landmark, Lawson, ION, Cloverleaf.
IPA and Infor Process Designer (IPD) will only show a fraction of the network traffic. For example for the WebRun activity node it only shows the HTTP response body, and unfortunately it discards the rest of the useful information.
With Wireshark
Wireshark can naturally intercept traffic from IPA and IPD.
Here are my screenshots for the WebRun activity node:
We get the entire HTTP request (header and body) and HTTP response (header and body). From that traffic we learn useful information about the WebRun activity node. For example, we learn what is the User-Agent String being used, we learn that IPA only uses the POST method (not GET), we learn that IPA automatically adds a leading slash to the URL path even if we don’t want it, and we learn that some versions of IPA have a bug in the Content-Type that always sets it to application/x-www-form-urlencoded even if we set it to something else. And we have the rest of the data to do the troubleshooting we may need.
And here are my screenshots for the Web Service activity node:
We get the entire HTTP request (header and body), HTTP response (header and body), SOAP request (header and body), and SOAP response (header and body). From that traffic we learn useful information about the Web Service activity node. For example, we learn what is the User-Agent String being used, and we learn that IPA will send our private M3 user/password to a server on the Internet even if we didn’t specify it (be careful if you leave Configuration blank, that means Configuration main, and if you had set an M3 user/password for M3 Web Services). And we have the rest of the data to do the troubleshooting we may need. This will prove crucial for troubleshooting M3 Web Services.
Here is a screenshot for the Email activity node:
You can even decode JDBC traffic from the SQL Query activity node, including JDBC traffic from IPA to its database. For that, in Wireshark select Decode As > TDS.
You can also decrypt HTTPS traffic (encrypted) of internal servers for which you have the private keys, such as M3 Web Services. For that, you can follow my previous post on how to decrypt Smart Office HTTPS traffic. I haven’t applied it here yet as I don’t have the server’s private keys so I can’t show you if it works or not, but I’m confident it would work.
With Fiddler
Fiddler can also capture HTTP traffic from IPA/IPD but we have to tell the JVM to use a proxy. I’ve only tested this with IPD; I haven’t tested this with IPA yet, but I’m confident it would work.
Also, Fiddler only captures HTTP, it doesn’t capture JDBC/SMTP.
Also, Fiddler can intercept and decrypt HTTPS (encrypted) traffic.
To set a proxy for IPD, open the IPD ini files and add the following arguments for the JVM:
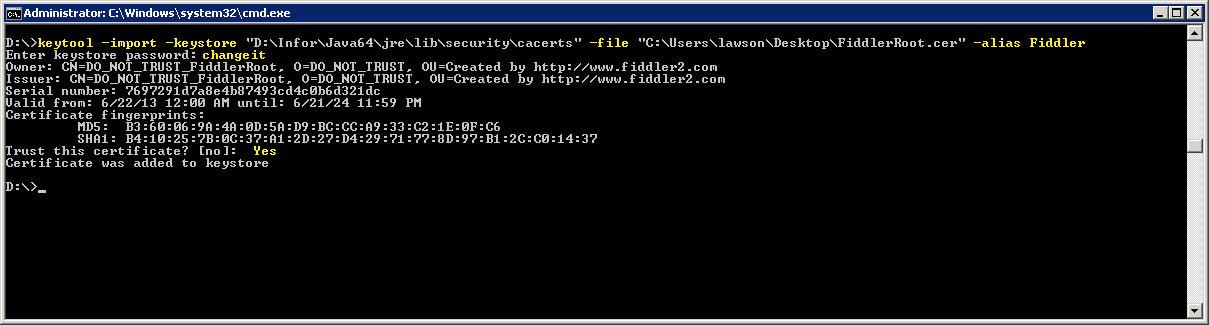
To decrypt HTTPS traffic you have to tell Fiddler to capture and decrypt HTTPS traffic, and you have to import Fiddler’s root certificate into the JVM used by IPD with the keytool:
And now you can intercept encrypted traffic from IPD as for example M3 Web Services in this screenshot:
Cleanup
After your troubleshooting, remember to remove the proxy arguments from the IPD ini files or IPD will break if you don’t have Fiddler running, and remember to remove the Fiddler DO_NOT_TRUST root certificate.
Summary
That was a brief illustration of how to intercept network traffic from Infor Process Automation and Infor Process Designer using Wireshark and Fiddler, and how to intercept and decrypt HTTPS traffic. This is very useful for me to troubleshoot the Web Run and Web Services activity nodes, specially for M3 Web Services.
That’s it! If you liked this, please follow this blog, leave your comments, and share around you.
I’m developing an application for Google Glass to have rich interactive picking lists from Infor M3 with:
list of items to pick with quantities and stock locations
a picture of the item from Document Archive so the user can get a visual cue of what to pick
floor plan of the warehouse with walking directions so the user can optimize the picking time
tap to confirm picking
Motivation
It’s a proof-of-concept of wearable computing for M3 and a base for future experiments in Augmented Reality for M3. Also, it’s a great visibility to showcase the integration capabilities of M3, and it’s a way to strengthen the collaboration between all the different actors (management, product development, consultants, colleagues, customers, partners).
I will make the resulting source code free software and open source on this blog and on my GitHub repository. I’m passionate enough about AR and I need to uplift my skills that I’m working independently on my own during evenings and week-ends. My goal is to complete the first set of features before Google I/O 2014 in two weeks from now. After that my next goal will be to complete the second set of features for Inforum 2014 in New Orleans on September 15-18 this year where I will do a demo with Peter.
Sponsorship
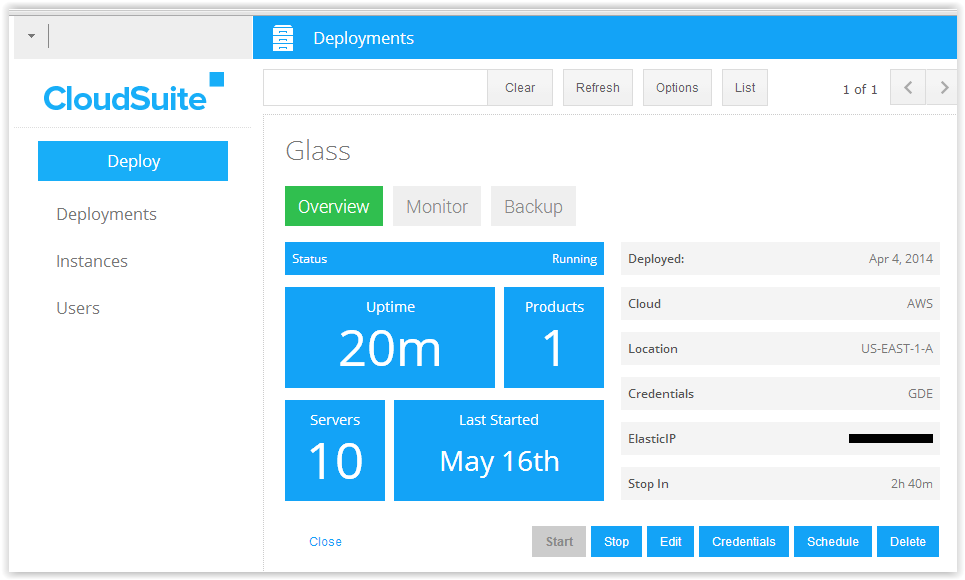
Peter A Johansson is the manager of the Global Demo Environment (GDE) Demo Services team at Infor. Peter is an appreciable visionary and has the necessary pragmatism and focus to make ideas a reality. I was looking around for an M3 server with Infor Smart Office and Infor Process Automation to do the software development, so I pitched the idea to Peter in April and at once he was attracted. He saw potential for a great demo at Inforum and suggested the idea to his manager. Peter and I have worked together in the past, and knows my drive, so he said: “We all know that if you give Thibaud what he needs then cool-stuff happens :-)” And they approved and made available for this project a full stack of M3 13.2 demo image servers on Infor CloudSuite deployed as virtual machines on Amazon Web Services (AWS).
Servers on Infor CloudSuite
The M3 stack for this project consists of: LifeCycle Manager (LCM), M3 Business Engine (M3 BE), Grid, Enterprise Search (IES), M3 Enterprise Collaborator (MEC), M3 BE BODs, Smart Office (ISO), H5 Client, Ming.le, ION Desk, Graphical Lot Tracker (GLT), Customer Lifecycle Management (CLM), Counter Sales for Distribution, Document Archive (DAF), MetaData Publisher (MDP), StreamServe for MOM, M3 Report Manager (MRM), Business Performance Warehouse (BPW), M3 Analytics, Event Hub, Event Analytics, Process Automation (IPA), Product Configuration Management (PCM), and more. For this project I only need M3 Business Engine, Event Hub, Event Analytics, Process Automation, and Document Archive.
The servers cost money per uptime and I can only work on this three times a week so I need to use the uptime carefully on a schedule we setup together based on my preferences.
Here is a screenshot of the Infor CloudSuite overview page:
Here is a screenshot of the schedule I chose:
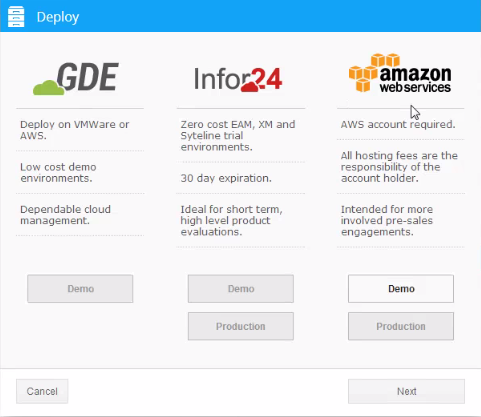
Here is a screenshot of the deployment selection (AWS in my case):
Demo @ Inforum
Peter and I will do a demo at the M3 Labs booth at Inforum in September. Come check it out. And if there is a feature you’d like to see at the demo let me know in the comments below.
After the demo at Inforum in September, I’ll re-assess the future of the project.
That’s it for the announcement! Special thanks to Peter A Johansson, his manager, the GDE Demo Services team, and Infor CloudSuite for believing in and sponsoring this project.