Grid MobileUI Management Pages

I recently came across Grid MobileUI, a mobile version of the Infor ION Grid Management Pages to efficiently monitor Grid Applications such as M3 on tablets and mobile phones like iPads and iPhones. I believe the Grid MobileUI was released with the new M3 13.1 in July. Here are some screenshots of the Grid MobileUI to spread the goodness.

The Grid MobileUI strips out the extra fat of the Grid Management Pages, keeping only the necessary information for an efficient user experience on a mobile device: you can easily see the list of Grid applications, you can check the errors and warning logs of each application, and you can automatically compose an email and it will paste the link to the page application details.

The Grid MobileUI is important to continue monitoring your M3 when you are on the move, for example when you are away from your office, commuting in the train, or waiting at the boarding gate at the airport. You can now pull up your tablet or your phone, and quickly address issues until you get back to your computer. It helps address issues faster and helps make more efficient use of your downtime.

In order to access the URL from your mobile device, you will have to use a VPN client on your mobile device to access your office network, or setup the web server in your DMZ and setup some form of encrypted authentication.

Here is a screenshot of the Infor ION Grid Management Pages for M3 showing the link to the Grid MobileUI:

2_

Here are two screenshots of the Grid MobileUI on an iPad, showing the main page, and one of the page application details:

5 6

Here is a screenshot of my iPhone’s Home Screen with the shortcut to the Grid MobileUI:

IMG_2487

Here are four screenshots of the Grid MobileUI on my iPhone, showing the main page, one of the page application details, the logs, and composing an email:

IMG_2489 IMG_2490 IMG_2491 IMG_2461

And if the Grid MobileUI is not enough for your administration needs, you can always request the desktop site on the iPad of the Grid Management Pages to get the full user interface, with the entire set of options, and all the detailed information:

7

That’s it!

Related articles:

  • H5 Client, a new HTML5 user interface for M3 that runs on mobile devices and modern browsers like Google Chrome.

Event graphs for Mashups

Today I introduce a new home-made tool that automatically generates event graphs from a Mashup‘s source code.

Motivation

I am currently doing some maintenance on a monster Mashup that has 20 data controls choreographed by 27 events where the height of the event tree is greater than 3, and I needed to understand the sequence of events so I can implement several new requirements in the Mashup without breaking the entire Mashup.

The tool

To assist me, I implemented a home-made tool with XSLT and XPath that automatically transforms the <mashup:Event> nodes of the Mashup XAML source code into a directed graph in the DOT graph description language that I rendered in GraphViz, an open source graph visualization software. I used what I learned from two of my previous tools: dependency graphs for data conversion, and Web Service pretty print.

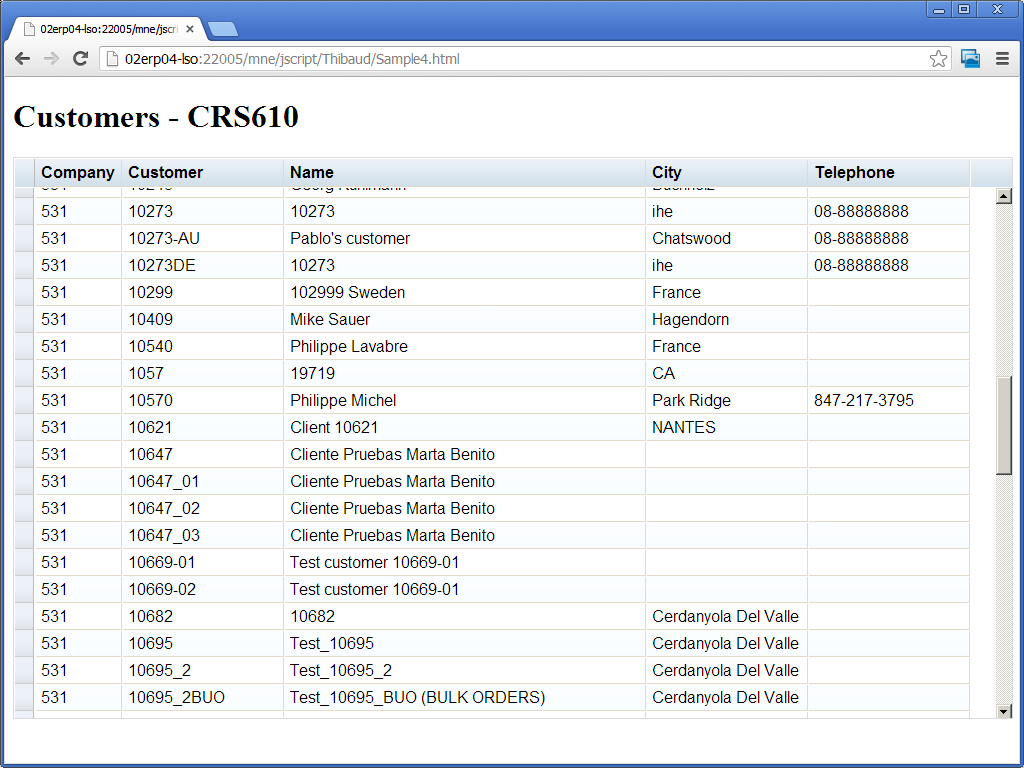
Suppose we have a Mashup with a Search button that triggers a search on a Customer list. We would have the following XAML code:

<mashup:Event
    SourceName="BtnSearch"
    SourceEventName="Click"
    TargetName="CustomerList"
    TargetEventName="Search" />

The idea is to take each event’s properties SourceName, SourceEventName, TargetName, and TargetEventName, and display them in a directed graph with nodes, edges, and labels using this DOT syntax:

digraph g {
    BtnSearch -> CustomerList [label="Click > Search"];
}

The result will look like:

2
We can automatically transform the XAML code into that DOT code with the following XSLT code:

<?xml version="1.0" encoding="UTF-8"?>
<xsl:stylesheet version="1.0" xmlns:xsl="http://www.w3.org/1999/XSL/Transform" xmlns:mashup="clr-namespace:Mango.UI.Services.Mashup;assembly=Mango.UI">
    <xsl:template match="/">
        digraph g {
            <xsl:apply-templates select="//mashup:Event"/>
        }
    </xsl:template>
    <xsl:template match="mashup:Event">
        <xsl:value-of select="@SourceName"/> -> <xsl:value-of select="@TargetName"/> [label="<xsl:value-of select="@SourceEventName"/> > <xsl:value-of select="@TargetEventName"/>"];
    </xsl:template>
</xsl:stylesheet>

The problem is that not all Events are fully qualified with all the properties SourceName, SourceEventName, TargetName, and TargetEventName. For instance the Mashup has an implicit SourceName <Global> that does not need to be explicitly qualified in the code. And the Button has the implicit SourceEventName “Click” that does not need to be explicitly qualified either. Thus, we need to handle those cases in the XSLT code. The resulting XSLT code is long and complicated with many if-then-else to test if the properties are blank, and, if they are, to test if the control has a known implicit property.

Finally, we will need an XSLT processing engine in order to get the result. Most major browsers have a built-in XSLT engine, for instance Microsoft Internet Explorer, Google Chrome, Safari, and Mozilla Firefox have a built-in XSLT engine. To test my tool on your computer, you can use Internet Explorer, Safari, and Opera as they will process the XSLT file locally from the disk with file://… On the other hand, Firefox and Chrome for security reasons will only process the file if it’s served from a web server with http:// so you would have to setup your localhost.

You can download the final XSLT file at http://thibaudlopez.net/Mashups/EventGraph.xslt

Preparation

Before using my tool, follow these steps:

  1. Download Graphviz from http://www.graphviz.org/ and start it from Windows > Start > Graphviz > gvedit.exe.
  2. Download my XSLT file from http://thibaudlopez.net/Mashups/EventGraph.xslt and save it somewhere in your file system.

How to use

To use my tool, follow these steps:

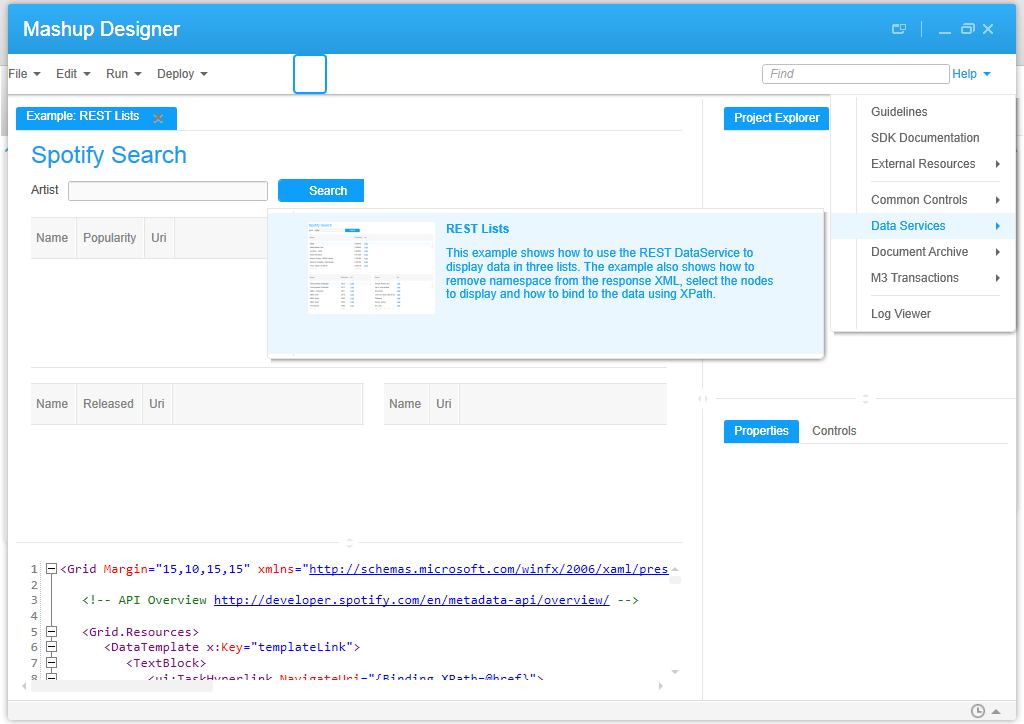
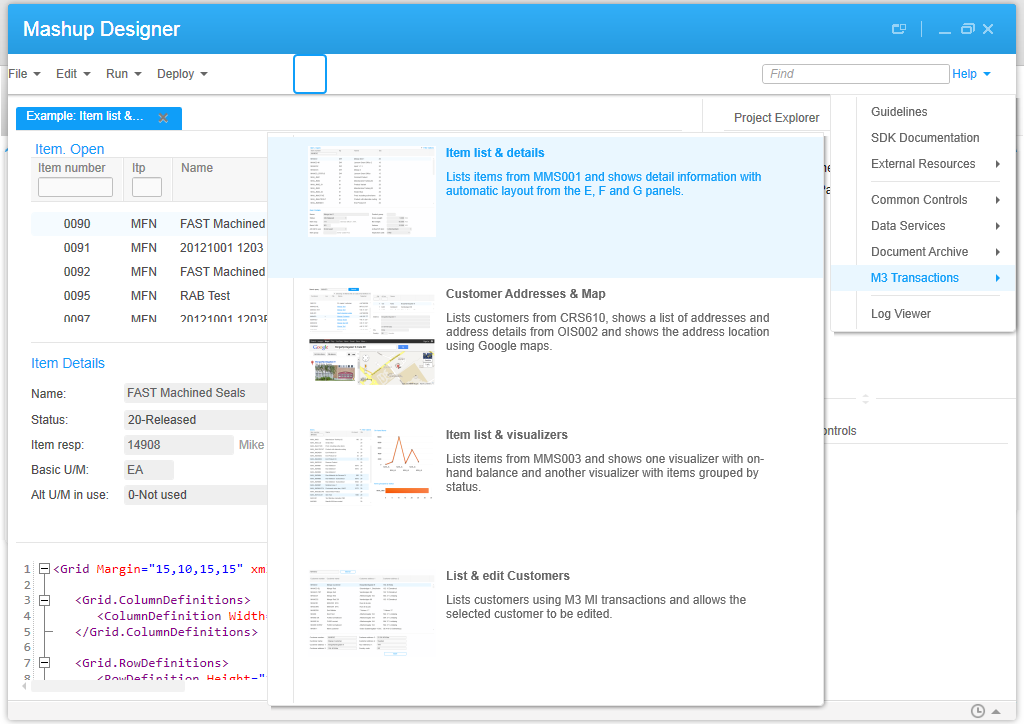
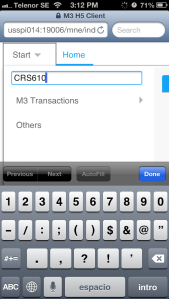
  1. Get some Mashup XAML code, for example from the Mashup Designer built-in examples, and save the XAML in the same folder as the XSLT file you saved previously:4
  2. Rename the file extension from XAML to XML so we can open it in one of the browsers later:
    5
  3. Add the following XSLT processing instruction at the top of the XML file:
    <?xml-stylesheet type=”text/xsl” href=”EventGraph.xslt”?>
    6
  4. Open the file in one of the browsers, for instance Internet Explorer:
    7
  5. In Graphviz, select File > New.
  6. Copy/paste the code that was generated in the browser:
    10
  7. Select Graph > Layout (F5) to generate the graph:
    11
  8. That’s it!

Results

Here are the resulting event graphs for five of the Mashup Designer’s built-in examples:

  1. REST Lists:
    213
  2. Item list & details:
    1 3
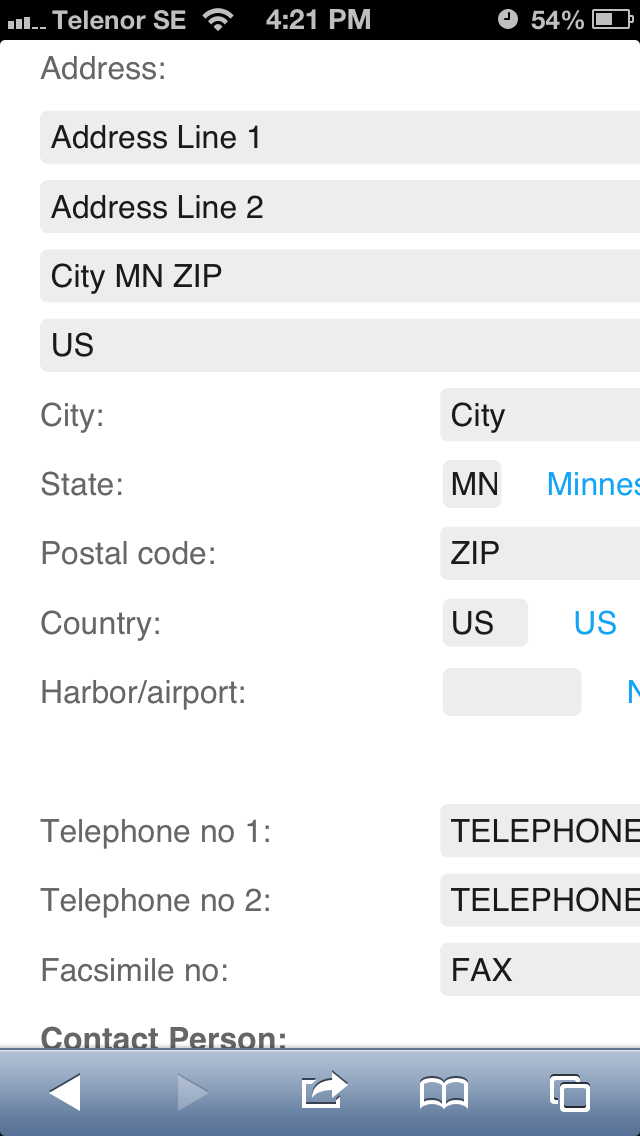
  3. Customer Addresses & Map:
    23
  4. Item list & visualizers:
    1 2
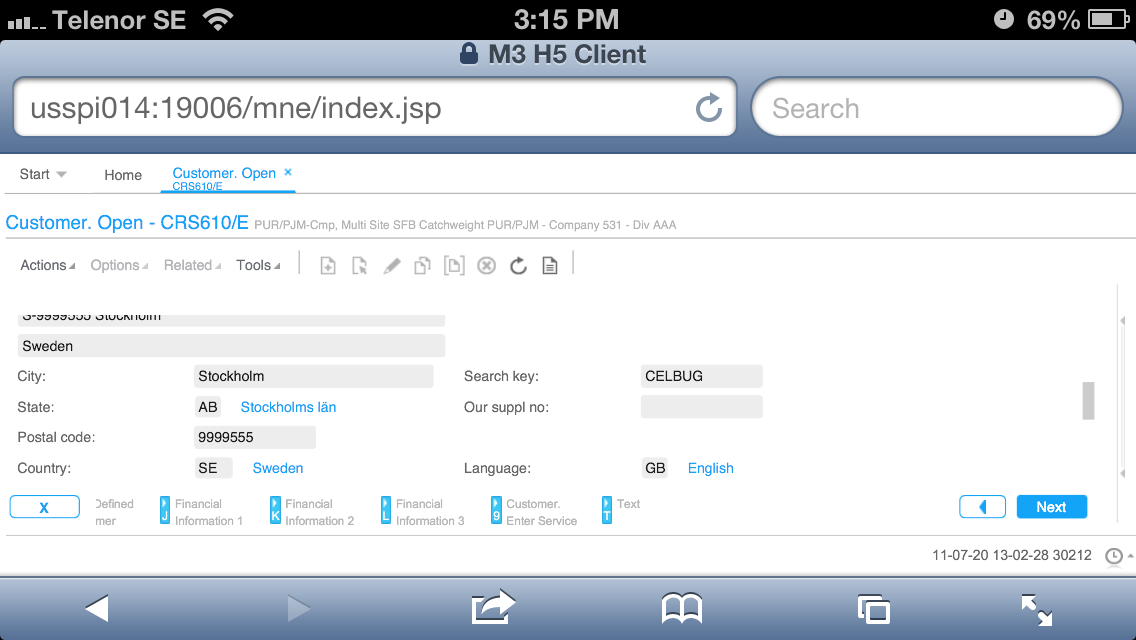
  5. List & edit Customers:
    1 10

Future work

In a future work, the XSLT code would have to be refined to cover all possible scenarios (blanks and implicit properties).

Also, we could include the Bookmark’s Keys or the Event’s Parameter Keys in the event graph, for example CONO, CUNO, ADRT, ADID.

7

The Who’s Who of Mashup Names and Descriptions

Every time I deploy a Mashup I forget which Mashup Name and Description goes where, I get confused, I have to fix the values and re-deploy. So here’s a Who’s Who cheat sheet that shows which Mashup Names and Descriptions goes where so I can remember. This cheat sheet will be helpful to save me time and hopefully it will be helpful to you as well.

I created a sample Test Mashup with the following values:

Project filename: Test.manifest
Project Name: The Project Name (the spaces will later be stripped when generating the Lawson application)
Project Description: The Project Description
XAML filename: Test.xaml
XAML VisibleName: The XAML Visible Name

I then generated the Lawson application and deployed the Mashup via LifeCycle Manager. Later, I also installed the Mashup as a Local Application to see if there were any differences.

The result  is the following:

  1. The developer sees all the values.
  2. The administrator only sees the Project Name and Project Description in LifeCycle Manager and in the Smart Office Local Applications.
  3. The Lawson application is generated using the Project Name as the filename, regardless of the Manifest’s filename; that’s by default and you can rename it.
  4. The user only sees the XAML Visible Name in the Mashup menu of the Navigator widget, and in the Mashup’s window title bar.

The developer, the administrator, and the user see different values in different places. That partially explains why I got confused. Now that I have a cheat sheet for my failing memory it should be easy to remember.

Here below are the screenshots of my tests.

1 2_ 3_ 4_  5

Hope it helps!

Data conversion techniques

Here below is an old slide I found in my archives where I list my known techniques for data conversion, i.e. how to push data into Infor M3, also known as data entry. This list intends to remind readers there are more solutions than the traditional techniques.

Data conversionTechniques

Traditional entry points

The two traditional entry points are:

  1. API – The traditional entry point is to call M3 API. Advantages: it’s the fastest and most reliable technique, and the most widespread in terms of platforms supported, libraries, tools, and documentation. Disadvantages: there aren’t M3 API available for every program/field/operation in M3, as given by the M3 API Repository – MRS001.
  2. MDP – When there’s no M3 API available, we use the other traditional entry point, Lawson Web Services (LWS) of type M3 Display Program (MDP) to simulate a user going through the screens at the middleware level in M3 Net Extension (MNE). Advantages: with the Lawson Web Services Designer we can create the equivalent of an M3 API, for most M3 Programs, in almost no time. Disadvantage: it’s less efficient to run than M3 API as there are more layers to traverse.

Those are the traditional techniques. And we massively call them with for example M3 Data Import (MDI), Smart Data Tool (SDT), M3 E-Collaborator (MeC), Visual Basic macros in Microsoft Excel, ProcessFlow Integrator (PFI), Infor Process Automation (IPA), Tibco, WebMethods, or custom Java/C#/VB programs, with the data coming from a source like for example a Microsoft Excel spreadsheet, a CSV or plain text file, or a staging database.

Alternate techniques

If the traditional entry points fail, there are two alternate techniques.

  1. Manual entry – We can always do manual data entry. Advantage: it requires almost no skills, no programming, and no tools. Disadvantage: it can become humanly impossible to manually enter large amounts of data.
  2. MAK – Alternatively, we can write an M3 modification with MAK, to create a new API or modify an existing one. Advantages: it’s the ultimate solution. Disadvantages: it requires an MAK developer, it can take time, and M3 mods create a maintenance problem.

Despair techniques

Then, there are the following techniques which are less know and which I use when I’m at a loss of ideas:

  1. MForms Automation – When there are no M3 API available, and when Lawson Web Services of type MDP fail for rare M3 programs, we can try to reproduce the steps with MForms Automation and write a Smart Office Script that loops thru a data source and executes the MForms Automation at each iteration. This is a proven technique and Seth will soon write a post illustrating this solution. Advantage: It’s the last card on the deck when you lost hope. Disadvantage: It’s less efficient because it’s at the user interface level.
  2. Bookmarks – Similarly, we can write a Smart Office Script to execute Bookmarks in a loop of the form mforms://bookmark?program=CRS620&tablename=CIDMAS&keys=IDCONO…
  3. MNEAI – Likewise, we can inject a piece of JavaScript in M3 Workplace to simulate a user’s data entry, and loop through a data source we get with JavaScript.
  4. H5 Client – We can do the same JavaScript injection for H5 Client.
  5. Macro – We can record the mouse movement and click events, and the keyboard keystrokes, and use a Windows program to replay them. Advantages: It’s the last solution available out of desperation. Disadvantage: it will break at the slightest change in window position or popup, and it will be slow.

Forbidden techniques

Finally, as a reminder, we never use SQL INSERT/UPDATE/DELETE to M3, as that would break the integrity of the ERP, it would bypass the cache of the data abstraction layer, and it would void warranty for support.

That’s it! Thanks for reading. Subscribe below.

How to render M3 API using Dojo DataGrid

Here is a solution to render the response of an Infor M3 API request into the Dojo DataGrid. This post is a continuation of my previous posts, How to call M3 API using the Dojo Toolkit, how to call M3 API with jQuery DataTables, and How to call an M3 Web Service using jQuery. Also, this is a solution for IBrix no longer supported.

<html>
<head>
<link rel="stylesheet" href="//ajax.googleapis.com/ajax/libs/dojo/1.9.1/dijit/themes/claro/claro.css">
<style type="text/css">
@import "//ajax.googleapis.com/ajax/libs/dojo/1.9.1/dojox/grid/resources/claroGrid.css";
#gridDiv {
 width: 1000px;
 height: 35em;
}
</style>
<script>dojoConfig = {parseOnLoad: true}</script>
<script src="//ajax.googleapis.com/ajax/libs/dojo/1.9.1/dojo/dojo.js"></script>
<script>
require(['dojo/_base/lang', 'dojox/grid/DataGrid', 'dojo/data/ItemFileWriteStore', 'dojo/dom', 'dojo/domReady!', 'dojo/request/xhr'],
function (lang, DataGrid, ItemFileWriteStore, Button, dom, xhr) {

    // make the M3 API request with dojo/request/xhr
    xhr('/m3api-rest/execute/CRS610MI/LstByNumber', {
       method: 'GET',
       withCredentials: true,
       user: 'Tschneider',
       password: '********',
       headers: {'Accept': 'application/json'},
       handleAs: 'json',
    }).then(render);

    // render the M3 API response with Dojo DataGrid
    function render(response) {
        // set up data store
        var data = {
            identifier: "id",
            items: []
        };
        var data_list = [];
        // loop thru the MIResponse
        for (var i in response.MIRecord) {
            // transform each MIRecord to an associative array accessible by key
            var record = {};
            response.MIRecord[i].NameValue.map(function (o) {
                record[o.Name] = o.Value;
            });
            // move each record to the data_list of the DataGrid
            data_list[i] = {
                col1: record['CONO'],
                col2: record['CUNO'],
                col3: record['CUNM'],
                col4: record['TOWN'],
                col5: record['PHNO'],
            };
        }
        for (var i = 0, l = data_list.length; i < data_list.length; i++) {
            data.items.push(lang.mixin({id: i + 1}, data_list[i % l]));
        }
        var store = new ItemFileWriteStore({data: data});

        // setup the DataGrid layout
        var layout = [[
            {'name': 'Company', 'field': 'col1', 'width': '75px'},
            {'name': 'Customer', 'field': 'col2', 'width': '150px'},
            {'name': 'Name', 'field': 'col3', 'width': '350px'},
            {'name': 'City', 'field': 'col4', 'width': '150px'},
            {'name': 'Telephone', 'field': 'col5', 'width': '150px'}
        ]];

        // create a new grid
        var grid = new DataGrid({
            id: 'grid',
            store: store,
            structure: layout,
            rowSelector: '20px'
        });

        // append the new grid to the div
        grid.placeAt("gridDiv");

        // call startup() to render the grid
        grid.startup();
    }
});
</script>
</head>
<body class="claro">
     <h1>Customers - CRS610</h1>
    <div id="gridDiv"></div>
</body>
</html>

Here is a screenshot of the result:

2

Note 1: The DataGrid will automatically provide client-side sorting and pagination, which in the case of M3 API is not suitable because we receive 100 records by default. So we have to implement our own server-side sorting and pagination, as well as handle positioning.

Note 2: I don’t like the solution too much as the data is copied seemingly four times in memory: in the response, in the data_grid, in the data, and in the store. There is most probably a solution to improve this memory footprint. I haven’t investigated yet.

Related articles

How to call M3 API using the Dojo Toolkit

Here is a solution to call Infor M3 API on the client-side using the Dojo Toolkit. This is a continuation of the previous posts, how to call M3 API with jQuery DataTables, and How to call an M3 Web Service using jQuery.

First, create an HTML file somewhere on the same domain as the M3 API REST endpoint as I explained in a previous post, for example:
1

Second, use the new dojo/request/xhr to make the HTTP Request to M3 API with REST/JSON:

<html>
<head>
<script src="//ajax.googleapis.com/ajax/libs/dojo/1.9.1/dojo/dojo.js"></script>
<script>
    require(['dojo/request/xhr'],
    function (xhr) {
        xhr('/m3api-rest/execute/CRS610MI/LstByNumber', {
        method: 'GET',
        withCredentials: true,
        user: 'Tschneider',
        password: '********',
        headers: {'Accept': 'application/json'},
        handleAs: 'json',
    }).then(function (response) {
        for (var i in response.MIRecord) {
            var record = {};
            response.MIRecord[i].NameValue.map(function (o) {
                record[o.Name] = o.Value; // transform each record to an associative array accessible by a key
            });
            console.log(record['CONO'] + ': ' + record['CUNO'] + ': ' + record['COR2'] + ': ' + record['WHLO'] + ': ' + record['TOWN']);
        }
    });
});
</script>
</head>
<body>
</body>
</html>

Then, open the webpage in a browser, in my case I used the Google Chrome JavaScript console (CTRL+SHIFT+J) to output the M3 API response:
2
That’s it! In a next post, I will show how to render the data using the Dojo DataGrid.

UPDATE 2013-07-10: To improve performance of client-side code for multiple M3 API requests, we can use the M3 API Pooling, the Generic pooling mechanism for client programs.

IBrix no longer supported?? Help!!

Hello community. Long time no seen. I’m back to posting on my blog to address a recurring question I’m receiving from various colleagues, customers, and partners around the globe, asking me about alternatives to IBrix now that IBrix is no longer supported since Infor M3 version 13.1 that was released in May.

The IBrix Programming Model (IPM) was a pretty advanced in-house technology in ~2001 based on a mix of server-side code (M3 API/LWS), middleware code (Servlets/JSP in WebSphere), and client-side code (XML/XSLT/HTML/CSS/JavaScript). Now that IPM is no longer supported, my recommended solution is to call M3 API and Lawson Web Services and render a user interface from the client-side using JavaScript frameworks. I wrote a sample to call M3 API with jQuery DataTables and Jessica wrote How to call an M3 Web Service using jQuery. Those are by far the easiest solutions I’ve found. An alternative is to write server-side code for example in ASP.NET and C#, and those are valid solutions as well.

Each solution has advantages and disadvantages with criteria based on architecture, programming preference, maintenance, etc. I don’t see performance being a problem either way. Also, the JavaScript frameworks are now pretty powerful in terms of multi-device-browser-version support. And the graphical components offer solutions for server-side sorting and pagination. The only caveat with client-side programming is not being able to maintain a session on the server, and needing to deal with that. Let me know if you have other criteria in mind. This post is more like a brainstorming of ideas. I’m eager to read your comments.

I will soon post an example using the Dojo Toolkit.

Progress indicator adorner

Last week in Stockholm norpe showed me how to add a progress indicator Adorner to a ListView when I call an M3 API in a background thread in a Personalized Script for Lawson Smart Office. When I execute a time consuming operation I like to maintain good usability by indicating activity to the user. For that, I used to display a message to the user in a Label like “Loading please wait…”, but that doesn’t catch the eye very well, and/or I used to changed the mouse cursor to Cursor.Wait. but I think that’s a shared resource. So I prefer this new technique.

It’s only two lines of code from Mango.UI.Controls:

ProgressIndicatorAdorner.AddAdorner(element, useOpacity, scaleFactor);
ProgressIndicatorAdorner.RemoveAdorner(element);

Here’s the method’s signature:
Reflector

Here’s the result:
1_ 2_

That’s it.

H5 Client

H5 Client is a new web-based user interface in Infor Workspace that brings Infor M3 to modern web browsers.

H5 Client is built using standard HTML5/JavaScript, and uses jQuery as one of the JavaScript libraries. It can potentially run on any major browser (Microsoft Internet Explorer, Google Chrome, Apple Safari, Mozilla Firefox, etc.), on potentially any operating system (Microsoft Windows, Mac OS, Linux, etc.), on potentially any device (PC, Mac, iPhone, iPad, Android, etc.). It’s a major milestone since the old Movex Workplace.

Movex Workplace had been built solely for Internet Explorer 6 over 10 years ago with non-standard IE-only features to optimize development and maintenance after Internet Explorer had emerged winner of the first browser war. Despite having been mono-browser, Movex Workplace had been praised by IDC as “the most technologically advanced business portal on the market” extensively using XmlHttpRequest long before the term Ajax was coined.

Fast forward to 2013, the web is growing exponentially with demand for multiple devices, multiple platforms, multiple vendors. H5 Client is the response to that demand and is a new player to complement its big sister Infor Smart Office.

H5 Client was announced and made Generally Available (GA) and I want to advertise it further with this post.

First tests with Google Chrome

  1. To determine if you have H5 Client, open the Grid Information page and look for Application Type mne:
    6
  2. Click on the /mne/ Web Application Link and authenticate with your M3 user/password. It will go to this Home page:
    1
  3. Start an M3 program as usual in the QuickStart, for example CRS610:
    2
  4. The M3 program will start like it did in Movex Workplace, but this time in a modern browser, Google Chrome for instance:
    3
  5. From here, use the program as usual, for example Options > Display CTRL+5:
    4
  6. And Options > Change CTRL+2:
    5

On Safari

Here is a screenshot of H5 Client in Safari on my PC:
3_

On the iPhone

I tested H5 Client on Safari on my iPhone, and here is the result:

Start > CRS610 > Options > Display CTRL+5:
IMG_9107 IMG_9110 IMG_9117

In Landscape View:
IMG_9112

Batch Customer Order – OIS275/B1:
IMG_9113

Customer Orders – OIS300/B:
IMG_9115

Shortcuts

Also, it’s possible to use Shortcuts like in Smart Office:
6

JavaScript

Also, I can use the browser’s Developer Tools and the JavaScript Console to integrate with the H5 Client with Classes similar to Smart Office Scripts (UserContext, Configuration, Controller, Content); that reminds me of MNEAI for Movex Workplace and will probably lead to more posts in the future:
7

Disclaimer

H5 Client is supposed to run as part of Infor Workspace. Thus, H5 Client alone won’t provide all the features necessary for the user.

Also, not all devices and browsers are officially supported. I successfully tested it in Internet Explorer, Google Chrome, and Safari on my PC, and Safari on my iPhone. It failed to run on Firefox on my PC (the entries in the Options menu were disabled), and on Chrome on my iPhone (it froze at /mne/index.jsp). And I yet have to test it on iPad, Linux, Mac OS, and Android.

For more information

To learn more about H5 Client, visit the Summit Week or Inforum 2013.

That’s it! I hope this quick overview will spark an interest in Infor Workspace and H5 Client.


UPDATE 2013-03-15: Added link to HTML5.