Today I had to troubleshoot why a refresh icon in a Smart Office Mashup was not refreshing, and after correcting it, I included the correction as a new predicate rule in my Mashup quality control tool to automatically spot similar errors in other Mashups.
IconButtons and CommandBarButtons
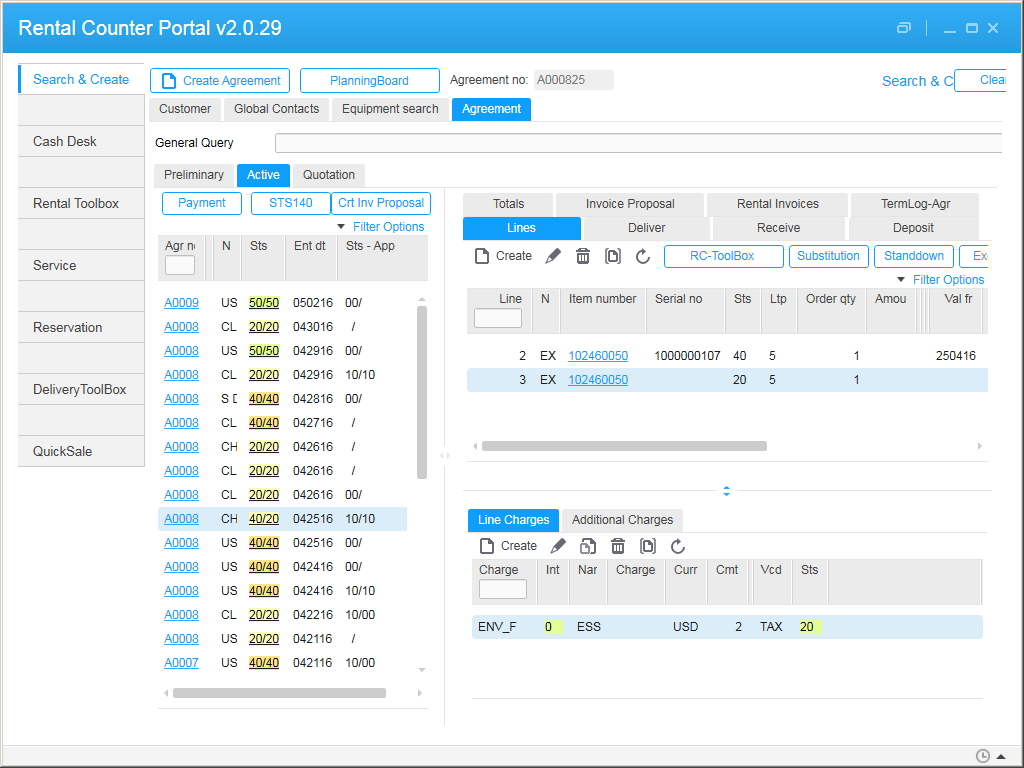
Here is a screenshot of the icon bar and its XAML code:

You can find more information about the Smart Office Design System’s Icons, IconButtons and CommandBarButons on norpe’s blog post.
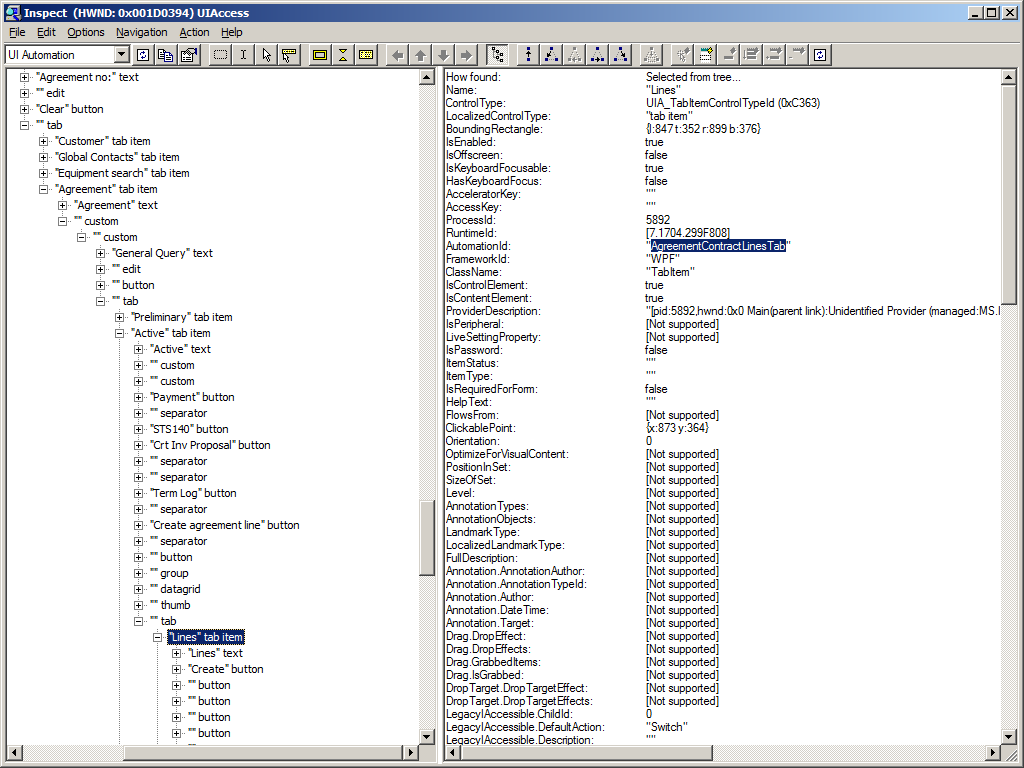
The error
After some manual troubleshooting, I found that the icon was refreshing the wrong list, i.e. the Click event had the TargetName property set to the wrong <m3:ListPanel>, it was set to PurchaseOrderList (incorrect) instead of RequisitionList (correct). Probably the developer copy/pasted the code from another tab and forgot to change the TargetName. That’s hard to find, quick to fix.
<ds:CommandBarButton IconName="Refresh" ToolTip="{mashup:Constant Refresh, File=Mango.UI}">
    <ds:CommandBarButton.CommandParameter>
        <mashup:Event TargetName="PurchaseOrderList" TargetEventName="Refresh" />
   </ds:CommandBarButton.CommandParameter>
</ds:CommandBarButton>
Finding other errors
Assuming the icons are grouped in a <StackPanel> followed by their <m3:ListPanel>, I can quickly find similar errors with the following XPath expression that lists all the icons TargetName:
//*[name()='ds:IconButton.CommandParameter' or name()='ds:CommandBarButton.CommandParameter']/mashup:Event/@TargetName
The Python code would be:
import os
import glob
import lxml.etree as etree

for f in glob.glob(os.path.join(r'C:\BuyerPortal', '*.xaml')):
    tree = etree.parse(f)
    r = tree.xpath("//*[name()='ds:IconButton.CommandParameter' or name()='ds:CommandBarButton.CommandParameter']/mashup:Event/@TargetName", namespaces={'mashup': 'clr-namespace:Mango.UI.Services.Mashup;assembly=Mango.UI', 'ds': 'clr-namespace:Mango.DesignSystem;assembly=DesignSystem'})
    for element in r:
        print(f, element)
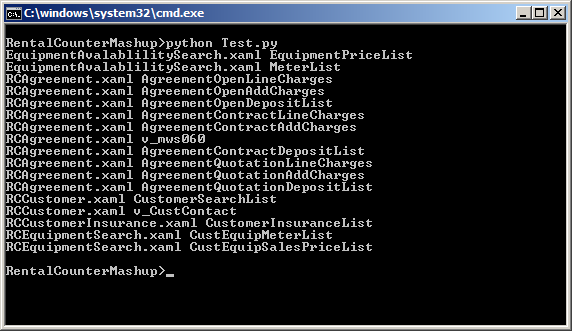
Result
Then I visually inspect the result for outliers. In my case, I see the error I found earlier, and a new error I did not know about:

This is a quick way to help identify errors before users have to.
Future work
This still requires a visual inspection of the result. A better solution would be to calculate the distance between the icon and its target m3:ListPanel in the XAML tree, where a minimum distance would indicate a low probability of error, and a maximum distance would indicate a high probability of error.
That’s it!
Please comment, like, subscribe, share, author. Thanks for your support.
Related posts
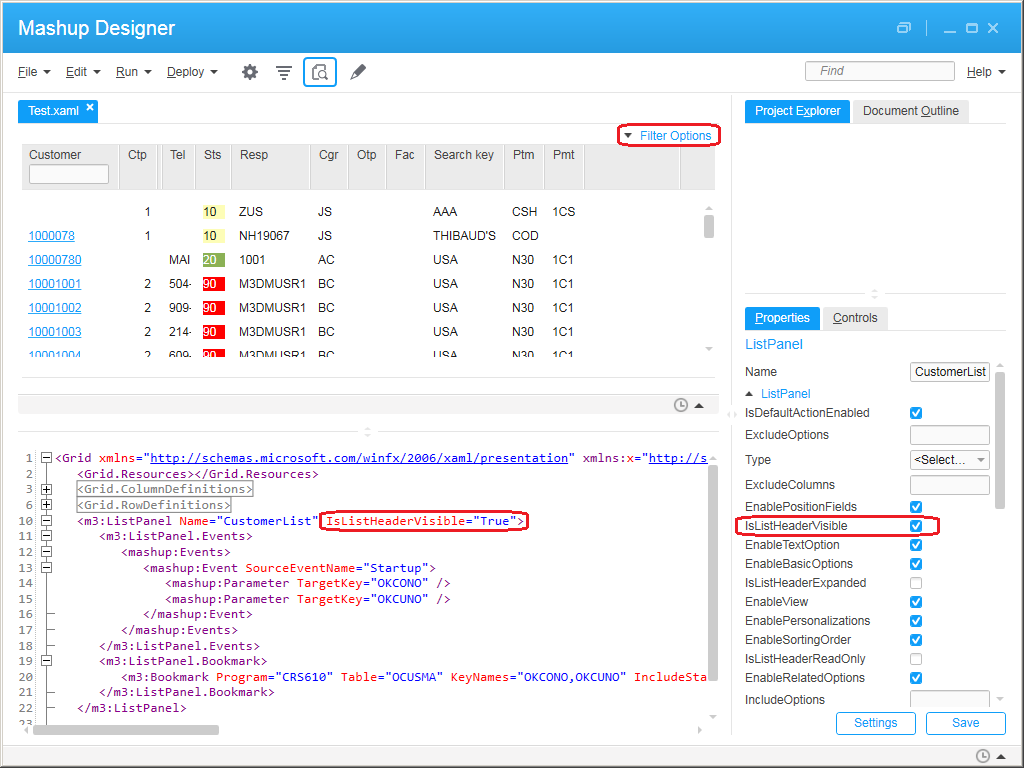
- Mashup quality control #1 – <m3:ListPanel IsListHeaderVisible=”True”>
- Mashup quality control #2 – icon buttons
- Mashup quality control #3 – Mashups
- Mashup quality control #4 – XAML
- Mashup quality control #5 – MForms Bookmark URIs
- Mashup quality control #6 – MForms Automation URIs